Unreal Insights includes Networking Insights to analyze, optimize and debug network traffic. Users can record trace information to visualize network behavior with the following features:
- Game Instance control to display visible machines during the network sessions being recorded
- Connection Mode control to visualize outgoing or incoming data
- Packet Overview panel that displays packet timelines (and sizes) being transmitted or received during a game
- Packet Content panel that shows a packet's content, such as replicated objects, properties, and remote function calls
- Net Stats panel that displays trace events for selected packets, including statistics about the total, maximum, and average exclusive (or inclusive) packet sizes.
Setup
To analyze data, enable Unreal Insights to record trace information. After the trace recorder is active, start game instances with the following command-line option:
-NetTrace=[VerbosityLevel] -trace=net
VerbosityLevel should be set to a value of greater than zero. For example, if a game instance starts with -NetTrace=1, Unreal Insights will collect and report network trace data for analysis by opening the session in Unreal Insights.
The editor runs its own data store for trace data, which means that you need to specify the tracehost in order to collect network trace data while running in the editor. To specify the tracehost, use: -NetTrace=1 -tracehost=localhost -trace=net
Networking Insights Window
The Networking Insights window is where you'll find networking session data.
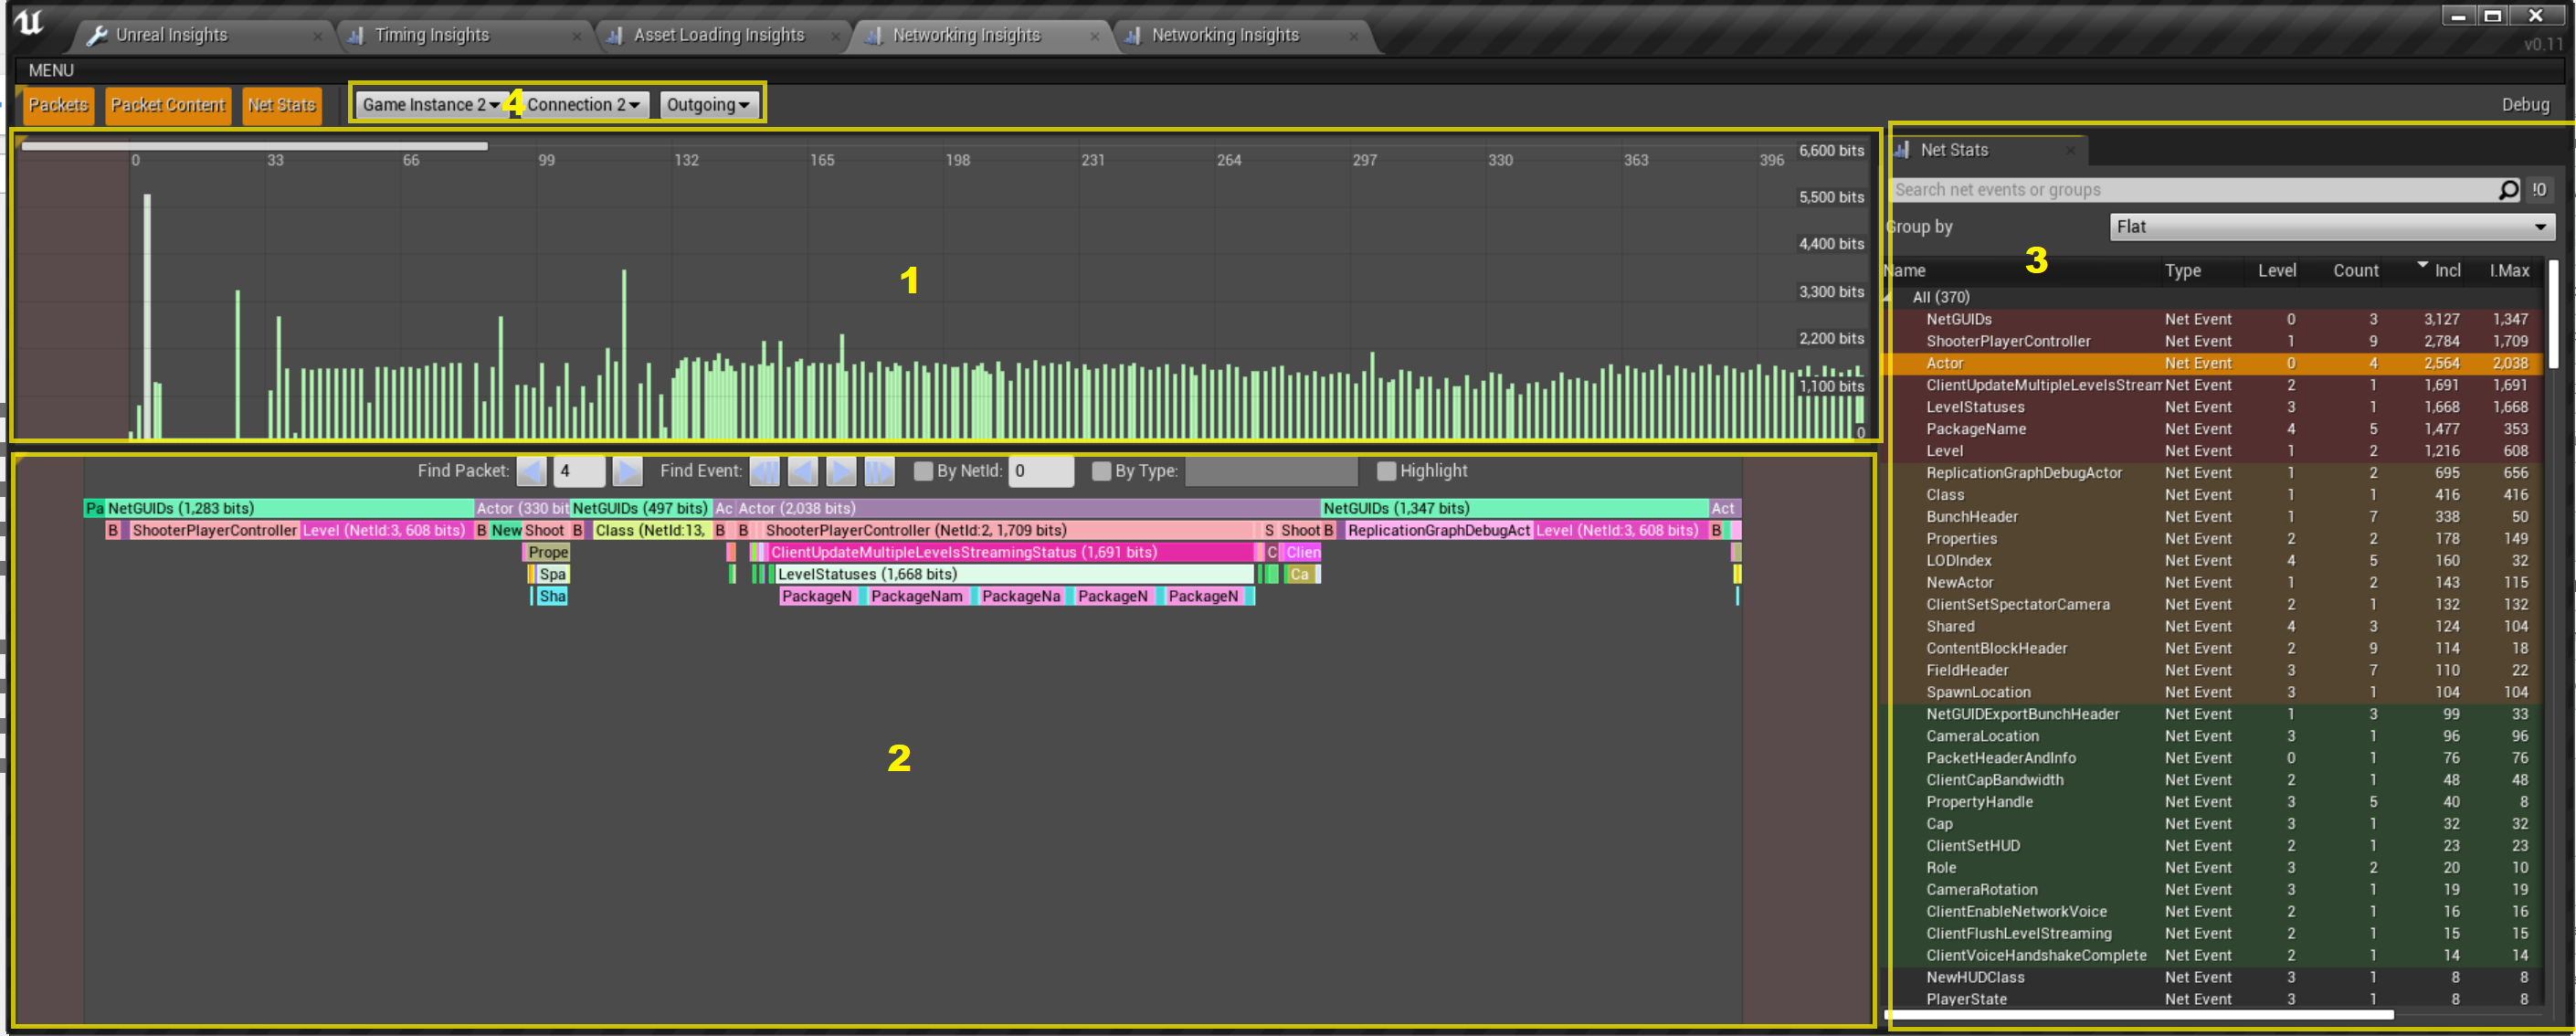
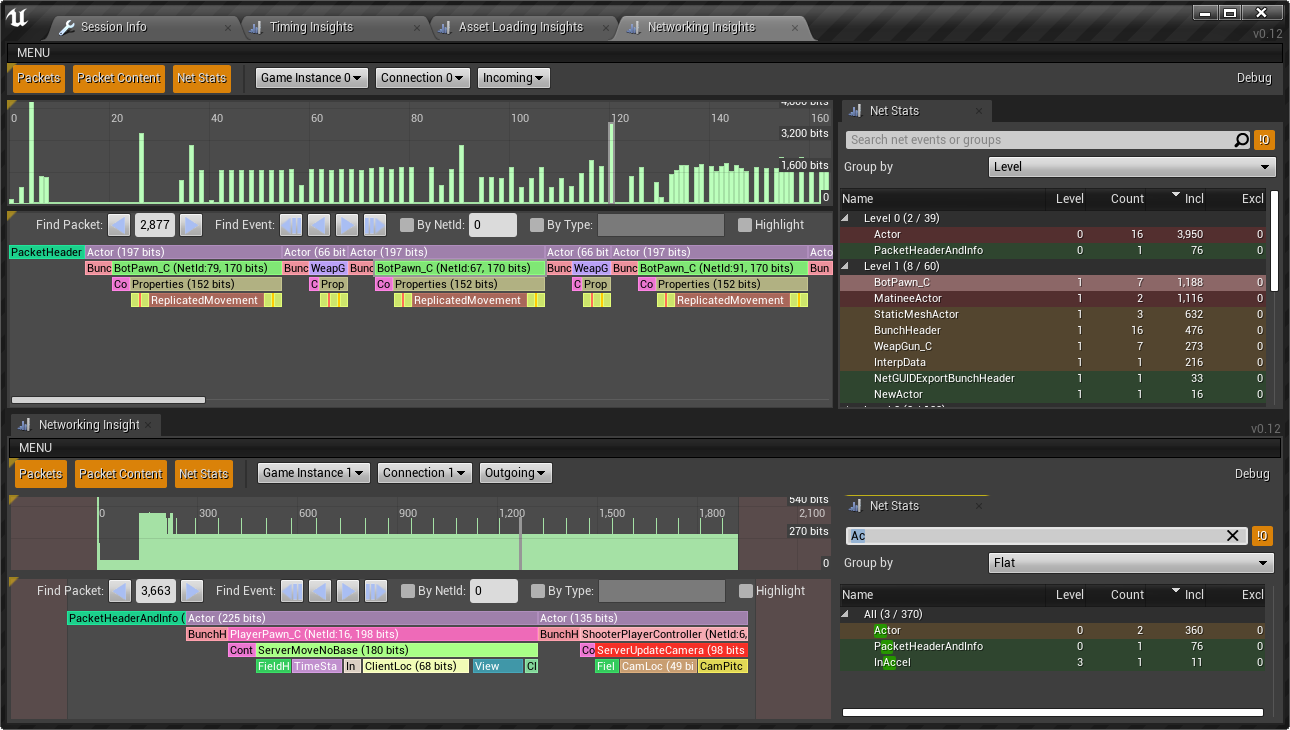
The Networking Insights window features the Packet Overview panel (1), the Packet Content panel (2), the Net Stats panel (3), and the Connection Selection panel (4).
Packet Overview Panel
The Packet Overview panel displays a bar graph that shows the size (in bits) for every packet received or transmitted. This is useful for identifying large packets that need further investigation. Left-click the bar to select a packet.
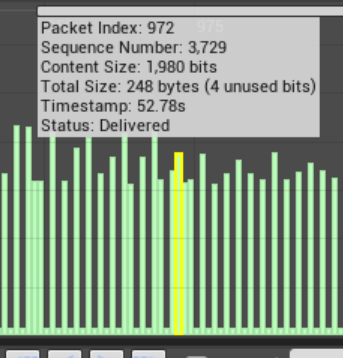
Hovering over a packet displays its information
To select multiple packets, click to select an inital packet, then hold the Shift key and click other packets. Dropped packets display in red.
Packet Content Panel
The Packet Content panel displays the actual content of the currently selected packet. The packet's content displays as a hierarchical event graph starting with bit zero on the left side. This is the main tool to investigate the data contents in each packet down to the property level.
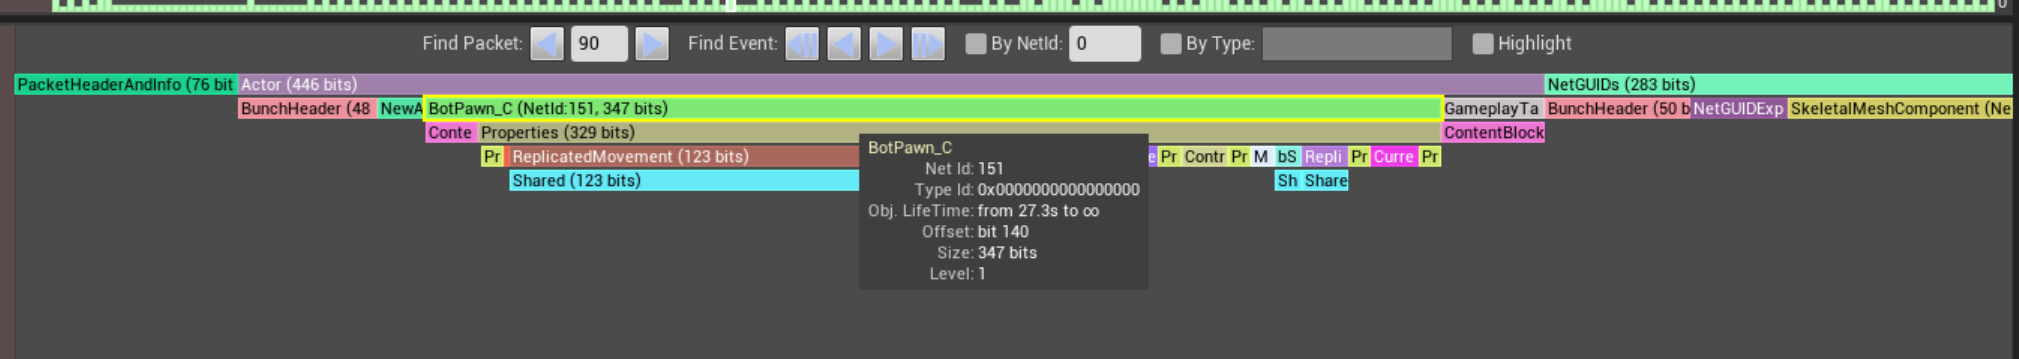
The first level displays the bunches contained in a packet. Each bunch is named after the channel that it belongs to. If the reported bunch has its debug name set when reported, the debugname will be used instead of the channelname to provide additional context (where available). The second level typically displays replicated objects contained in the bunch. If the event has an assigned NetId(NetGUID), the ID is on display as well. Hovering over an event displays all of the event's information. Further down the event hierarchy, replicated properties (including how many bits they wrote) are on display.
Connection Dropdown Lists
The top of the Packet Overview panel has controls that let users select the data to display.
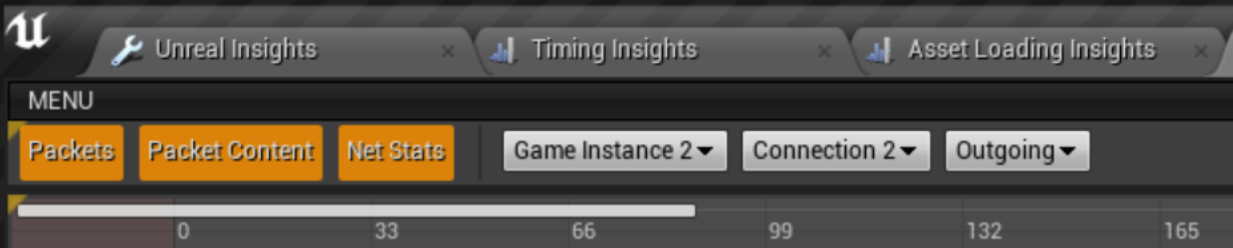
Dropdown lists are available in the Packet Content panel:
| Dropdown List | Description |
|---|---|
| Game Instance | Displays the created Game Instance for each unique NetDriver observed during a recording session. For example, when using PIE, there are separate instances for the server and each client. |
| Connection | This dropdown selects a specific connection, displaying every observed connection during the selected Game Instance's session. |
| Connection Mode | This dropdown controls whether to visualize incoming our outgoing data. |
Net Stats Panel
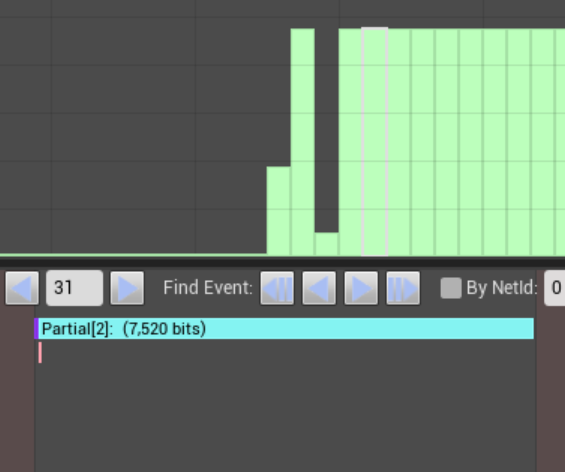
The Net Stats panel lists all trace events for the selected packet range in the Packet Overview panel.
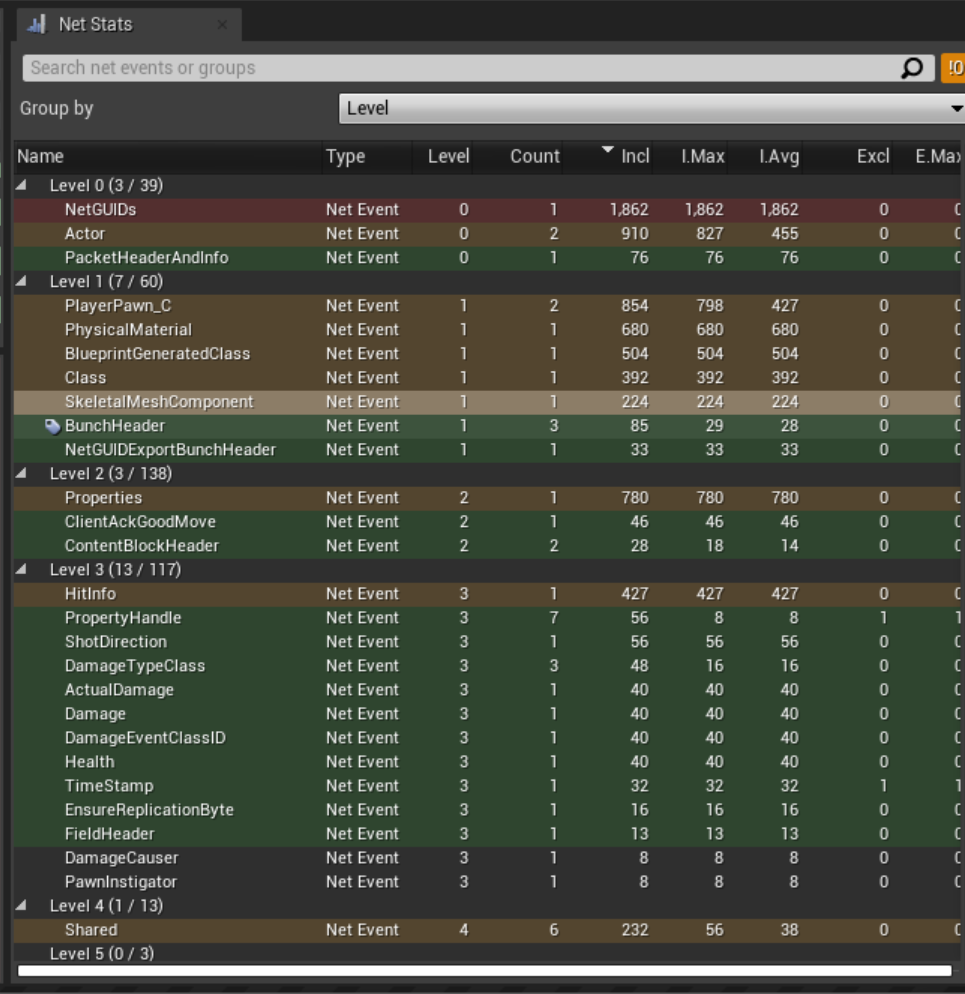
The Net Stats panel with events grouped by level
In addition to aggregating data based on a selected range, users can sort the list in ascending or descending order by the values in any active column. Right-click anywhere in the list to change the sort order, or to activate or deactivate columns. The following columns are available:
- Type
- Level
- Instance Count
- Total Inclusive Size (bits)
- Max Inclusive Size (bits)
- Total Exclusive Size
- Max Exclusive Size
To filter events by name, use the "search net events or groups" field. Users can group according to these event types:
- Level
- Flat
- Name
Grouping by Level helps users understand their data better because the same name can (and will) appear on different levels. The following table describes these levels:
| Level | Description |
|---|---|
| 0 | Typically channel information that displays all bunches using the channel name. |
| 1 | Replicated Object (Actor), most events at this level show the serialized object. |
| 2 | Reports events originating from property replication or from RPCs. |
| 3 | Reports events when serializing properties. |
| 4 | Reports additional events when serializing properties, array content, and more. |
Example Data
To better understand the data that Networking Insights visualizes, we offer the following examples:
Replicated Objects

This is the initial replication of a new Actor--ReplicationGraphDebugActor, NetGUID 10.
Before the bunch containing the new actor, there is a NetGUID bunch containing all of the exported references from the new Actor, including NetGUIDS.
RPCs
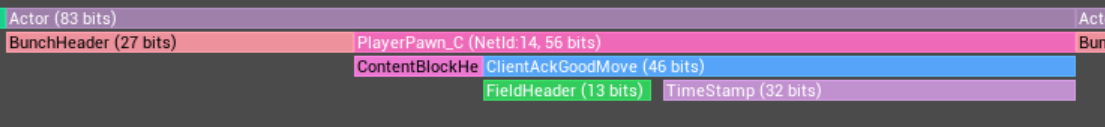
This is an RPC named ClientAckGoodMove that targets PlayerPawn_C with NetGUID 14.
Split Bunches
Event data generated from transmitting a split bunch report with the first part--when receiving a split bunch, parts are reported first, and when all parts are received, events are reported with the final part.
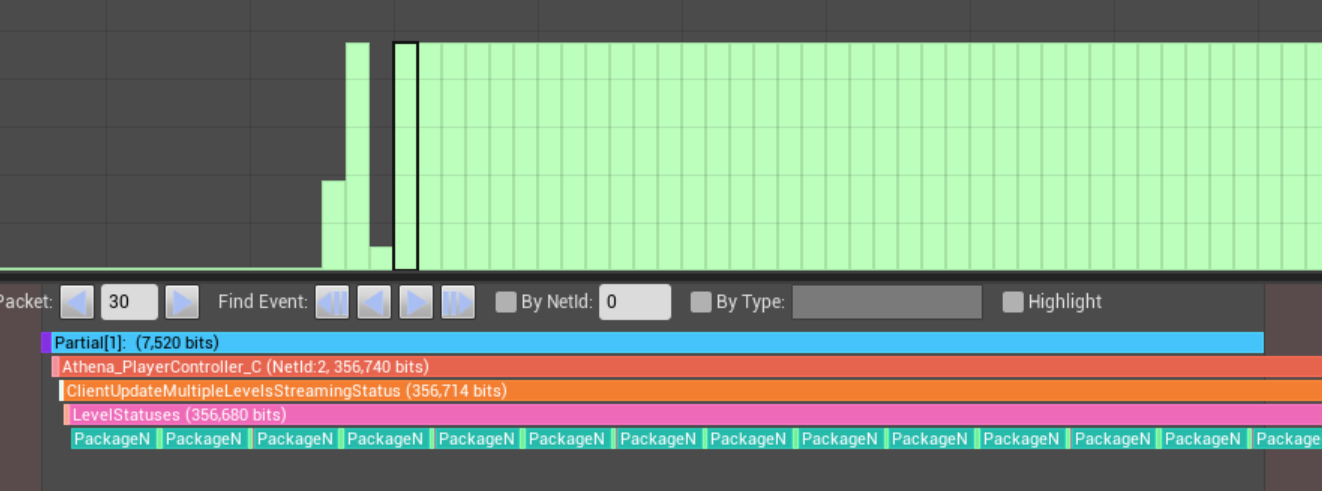
This is a split outgoing bunch. Note that the events in the bunch are larger than the Bunch.
The next few packets look like the following:
SubObjects
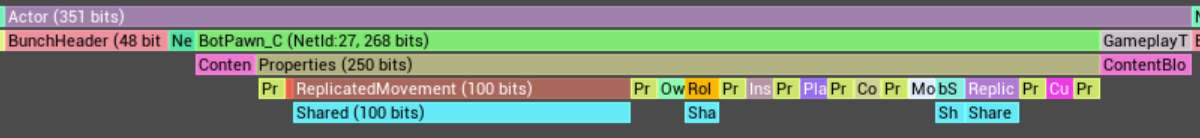
This is a SubObject example--note that the second Actor after BotPawn_C shares the same bunch.