Profiler is the replacement for Unreal Engine 3's StatsViewer tool and is used to monitor the performance of a game by collecting and tracking game data. This data can then be used to identify possible sources of slowdowns or hitches in your game.
If you are new to performance tuning, you may want to refer to the Performance and Profiling documentation first, as there are several tips in there that will help illustrate how to monitor your game's performance.
Enabling Profiler
There are two methods you can use to enable Profiler and collect data:
- Live Connection
- Run the game with the parameter -\messaging (for example: UE4Editor-Win64-Debug.exe -messaging).
- Run the UFE with the parameter -\messaging (for example: UnrealFrontend-Win64-Debug.exe -messaging).
- Select Session Frontend from the Developer Tools section of the Window menu bar, then select the Profiler tab.
- Load previously captured data
- By pressing the Load button on the toolbar from the Profiler tab and selecting a .ue4stats file.
- By dropping a stats file from explorer or other file manager into the Profiler window.
You can also launch the stand-alone UnrealFrontEnd.exe from the C:\Program Files\Unreal Engine\4.3\Engine\Binaries\Win64 folder to gain access to Session FrontEnd and the Profiler tab. (Note: your version number may differ from the path above).
Profiler Window
Below is the Profiler window and UI components:
Click image for full view.
- The Connected Session and Session Information window - used as the session to obtain the stats data.
- The Main Toolbar window - contains basic global functionality.
- The Data Graph Full window - provides a full view of the graphical presentation of stats.
- The Data Graph window - is the graphical presentation of the stats.
- The Filter and Presets window - contains all stats and groups (user can filter and sort these stats and groups).
- The Event Graph window - shows the selected frame or frames as the event graph.
Main Toolbar
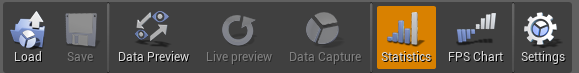
Below are descriptions of each action contained on the Main Toolbar:
| Option | Description |
|---|---|
 |
Allows you to load a stats file. |
 |
This option is not yet implemented. |
 |
Only for live connection, enables communication with the connected session/client (when active, the icon will be lit). |
 |
Only for live connection, enables live synchronization of the data graph view (when active, the icon will be lit). |
 |
Only for live connection, captures the data on the client. When capture is complete, a pop-up message will ask if you would like to transfer the capture data to the user's machine. Once the data is transferred, a pop-up message will appear and allow you to load the stats file if desired. |
 |
Enables the Stats Profiler. |
 |
Displays the FPS Chart (This option is work-in-progress). |
 |
Opens the settings for the Profiler: enable/disable Single Instance Mode or Show Coalesced View Modes in Event Graph. |
Data Captured files are stored in the following location ...\UE4\Engine\Programs\UnrealFrontend\Saved\Profiling\UnrealStats\Received...
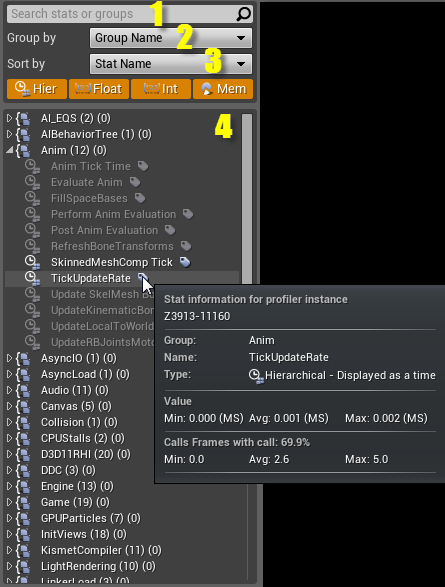
Filters and Presets
Below are descriptions of each action contained on the Main Toolbar:
| Option | Description |
|---|---|
| Search Box (1) | Used to find a stat, after typing a string, matched elements will be highlighted in the Stats/Groups Window. |
| Group By (2) | Method in which stats are grouped, by default stats are grouped by Group Name. |
| Sort By (3) | How to sort stats within the group, by default stats are sorted by Name. |
| Stats/Groups Window (4) | Displays the Stats and Groups. Click the |
| Toggles displaying hierarchical stats, aka scope counters. | |
| Toggles displaying floating points, double counters, and accumulators. | |
| Toggles displaying integer stats, word counters and accumulators. | |
| Toggles displaying memory stats (This option is work-in-progress). |
How to Track Stats
There are three methods you can track stats:
- Double-click on the selected stat to add/remove it from displaying on the Data Graph View.
- Drag-and-drop it from the Stats/Groups Window into the Data Graph View (see the image below).
- Drag-and-drop it from the Event Graph View.
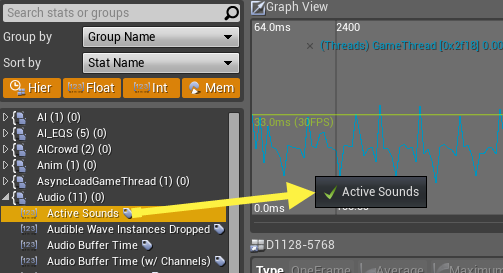
If a stat is being tracked, it will be displayed in a different color and with an "*" symbol next to the name.
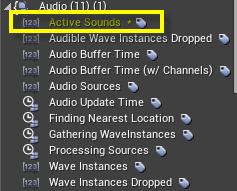
Also, you can see how many stats are being tracked in a group by looking at the second number in the () following the Group Name.
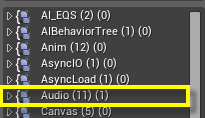
The image above for Audio, there are 11 items in the group, 1 of which is currently being tracked.
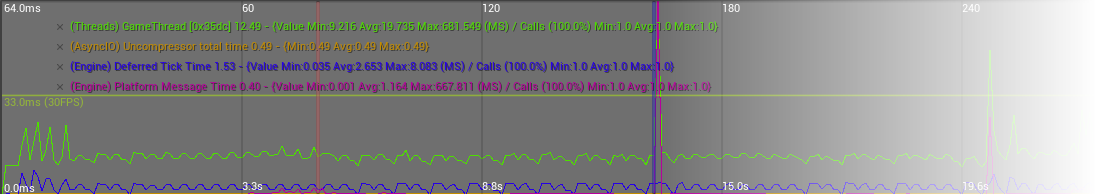
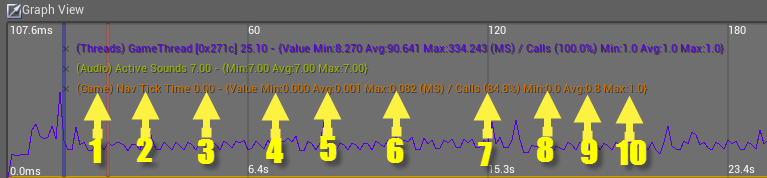
Data Graph
The Data Graph view displays all tracked stats. To stop tracking a stat, press the (X) button in front of the stats' text.
The stat's text consists of the following information and is broken down below:
- (Group Name) - The Group Name of the stat.
- Stat Name - The name of the stat.
- Actual Value - The actual value of the stat.
- Min Value - The minimum value based on the whole capture.
- Avg Value - The average value based on the whole capture.
- Max Value - The maximum value based on the whole capture.
- Calls - The percent of frames with a call to this stat (for hierarchical data only).
- Min Value - The minimum number of calls to this stat based on the whole capture (for hierarchical data only).
- Avg Value - The average number of calls to this stat based on the whole capture (for hierarchical data only).
- Max Value - The maximum number of calls to this stat based on the whole capture (for hierarchical data only).
The values denoted with for hierarchical data only are only displayed for hierarchical data and may not be displayed.
An explanation of the Data Graph axes are also outlined below:
- Bottom - Display the time from the beginning, starting from 0.0.
- Top - Display the frame number from the beginning, starting from 0.0.
- Left - Display adaptive information about time, in ms, based on the zoom level. Using the Mouse Wheel, there are three predefined axes for a game running at 30, 60 or 100 FPS each displayed in a different color.
- Right - Display adaptive information about other stats like float or memory. This axis has different scale than the left one due to the fact that float or memory values are usually larger than time related stats.
Right-clicking in the Data Graph window will also present a context menu with additional options:
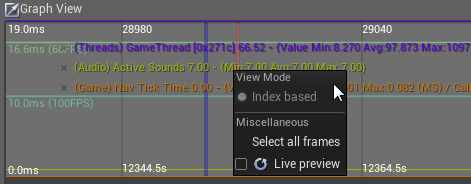
- View Mode - At this time only Index based mode is supported (Time based mode is only available in the multisession mode of the Profiler and is an experimental feature disabled by default).
- Select All Frames - This selects all frames and updates the Event Graph View.
- Live Preview - This option is the same as presented in the main toolbar.
Event Graph
The Event Graph View consists of the following:
- Title - Displays the current connected session name or the currently loaded stats file.
- Event Graph Toolbar - Used for Event Graph filtering and other functionality.
- Function Details - Detailed view of the selected event/function.
- Main Event Graph - Hierarchical view of the selected frame or frames.
Event Graph Toolbar

Below are descriptions of each action contained on the Event Graph Toolbar:
| Option | Description |
|---|---|
| Enabled only if one frame has been selected on the Data Graph. | |
| Enabled by default if several frames have been selected on the Data Graph, this is a per-frame average graph. | |
| Can be enabled if several frames have been selected on the Data Graph, this is the highest per-frame graph. | |
| Displays the contents in the Main Event Graph in a hierarchical tree view. | |
| Displays the contents of the Main Event Graph in a flat list of events, sorted by Inclusive Time. | |
| Displays the contents of the Main Event Graph in a flat list of events, coalesced by the Event Name and sorted by Inclusive Time. | |
| Displays the contents of the Main Event Graph in a flat list of events, sorted by Exclusive Time. | |
| Displays the contents of the Main Event Graph in a flat list of events, coalesced by the Event Name and sorted by Exclusive Time. | |
| Action History backwards button. | |
| Action History forwards button. | |
| Displays the Action History menu. | |
| Expands hot path for selected events based on the inclusive time and enables descending sorting by the inclusive time (this is the most performance-expensive path). |
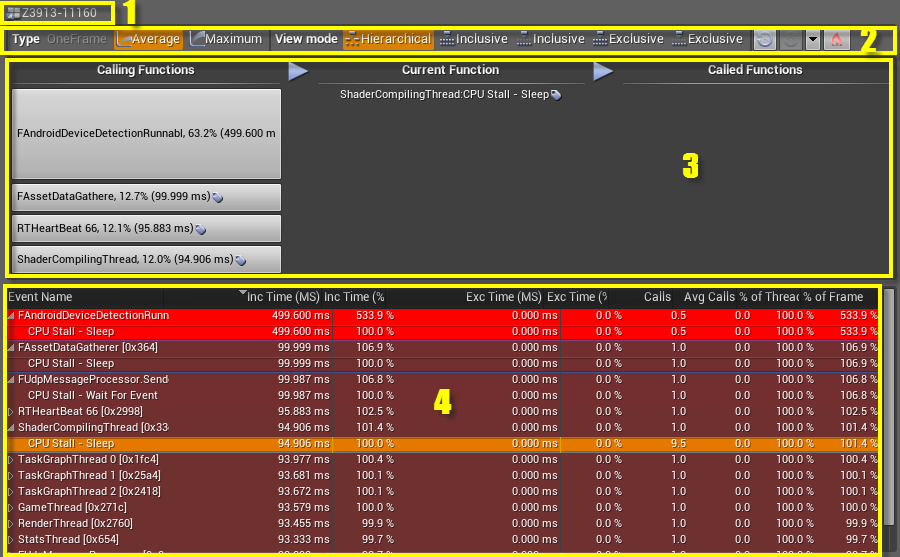
Function Details
Function Details show relationships between a function/event that the user selects and the callings functions that executed the selected function/event. These relations are displayed using the buttons scaled accordingly to the percentage values.
The user can easily follow from the top event to the bottom event looking for the performance offenders. Function Details view is synchronized with the Main Event Graph in both ways, so selecting a new function will also select that function in the Main Event Graph.
Function Details consist of the following elements:
- Calling Functions - Shows the functions that called the selected function. The size of the widget is scaled based on the percentage values.
- Current Functions - Currently selected event/function in the Main Event Graph event.
- Called Functions - The functions called by the selected function. The size of the widget is scaled based on the percentage values.
 - When this is shown, the event has been culled in the Main Event Graph window (more information on this in the next section).
 - When this is shown, the event has been filtered out in the Main Event Graph window (more information on this in the next section).
Remember that hovering over the ![]() icon will display additional information about the item.
icon will display additional information about the item.
Main Event Graph
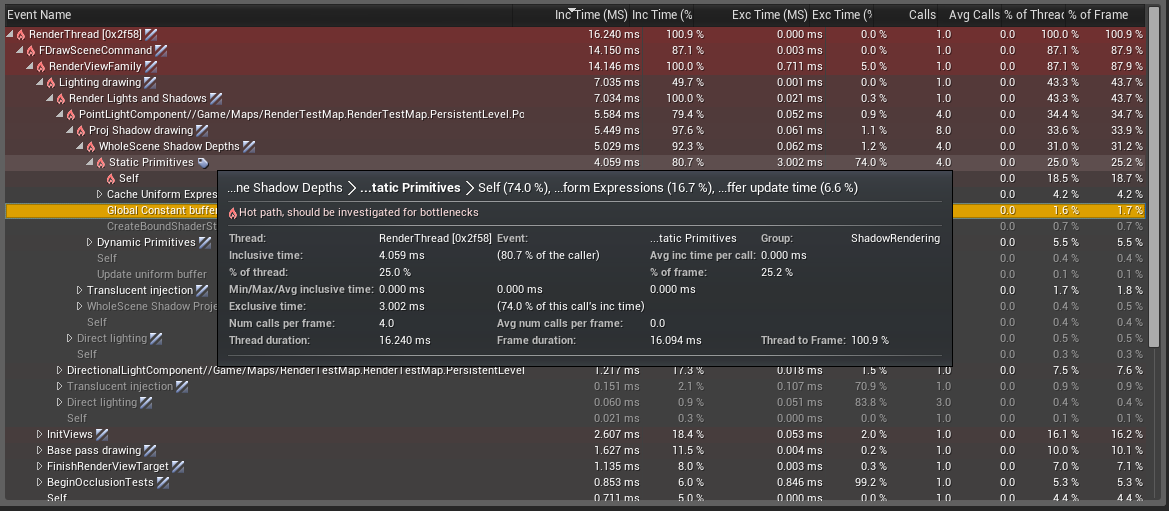
The Main Event Graph window shows the event execution paths. There is no one root, but each thread has its own starting event. This is usually indicated by the "thread" in the name or the numeric ID of the thread, such as "[0x1234]".
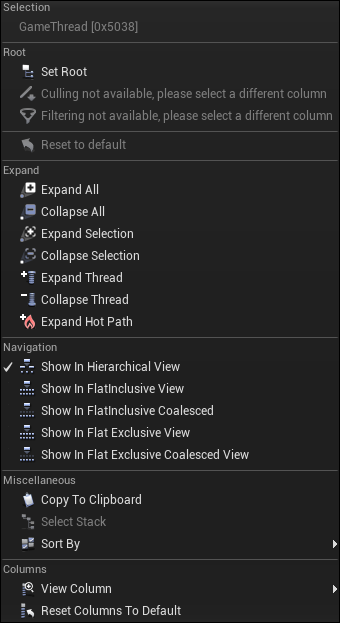
The Main Event Graph allows you to filter, cull, and many other functions. These functions are outlined below and are accessible by Right-clicking in the Main Event Graph window and choosing the desired action from the context menu that appears.
| Option | Description |
|---|---|
| Selection | Displays the name of the selected event. |
| Set Root - Sets the root to the selected event(s) and switches to hierarchical view. | |
| Cull Events - Cull events to 'Value' based on 'ColumnName'. Available only for column "Inc Time (MS)". These events will be removed from the graph, the parent of these events will display the (IconCulled.png)(w:20 convert:false) icon. For easier navigation, the user can press this icon to restore the culled events. If culling is not available, this option will be grayed out. | |
| Filter Events - Filter events to, 'Value' based on 'ColumnName'. Available only for column "Inc Time (MS), Exc Time (MS), Calls". These events will be displayed in gray in the graph. If Filtering is not available, this option will be grayed out. | |
| Reset to Default - For the selected event graph, resets Root, Culling and Filtering to the default state and clears the Action History. | |
| Expand All - Expands all events. | |
| Collapse All - Collapses all events. | |
| Expand Selection - Expands selected events with children. | |
| Collapse Selection - Collapse selected events with children. | |
| Expand Thread - Expand selected thread with children. | |
| Collapse Thread - Collapse selected thread with children. | |
| Expand Hot Path - Expands hot path for the selected events, based on the inclusive time, and enables descending sorting by inclusive time (this is the most performance-expensive path). | |
| Show in Hierarchical View - Switches to hierarchical view and expands selected events. | |
| Show in Flat Inclusive View - Switches to flat inclusive view and enables descending sorting by inclusive time. | |
| Show in Flat Inclusive Coalesced - Switches to flat coalesced and enables descending sorting by inclusive time. | |
| Show in Flat Exclusive View - Switches to flat exclusive view and enables ascending sorting by exclusive time. | |
| Show in Flat Exclusive Coalesced - Switches to flat exclusive coalesced view and enables ascending sorting by inclusive time. | |
| Copy to Clipboard - Copies selection to the clipboard. | |
| Select Stack - Selects all events in the stack. | |
| Sort By - Displays a menu which allows you to sort by specific column and to change sorting mode. | |
| View Column [List of the available columns] - Displays a menu which allows you to show or hide columns. | |
| Reset Columns to Default - Resets columns to their default setting. |