This page is published in a draft state in order to make the information available as early as possible. Check back for updates.
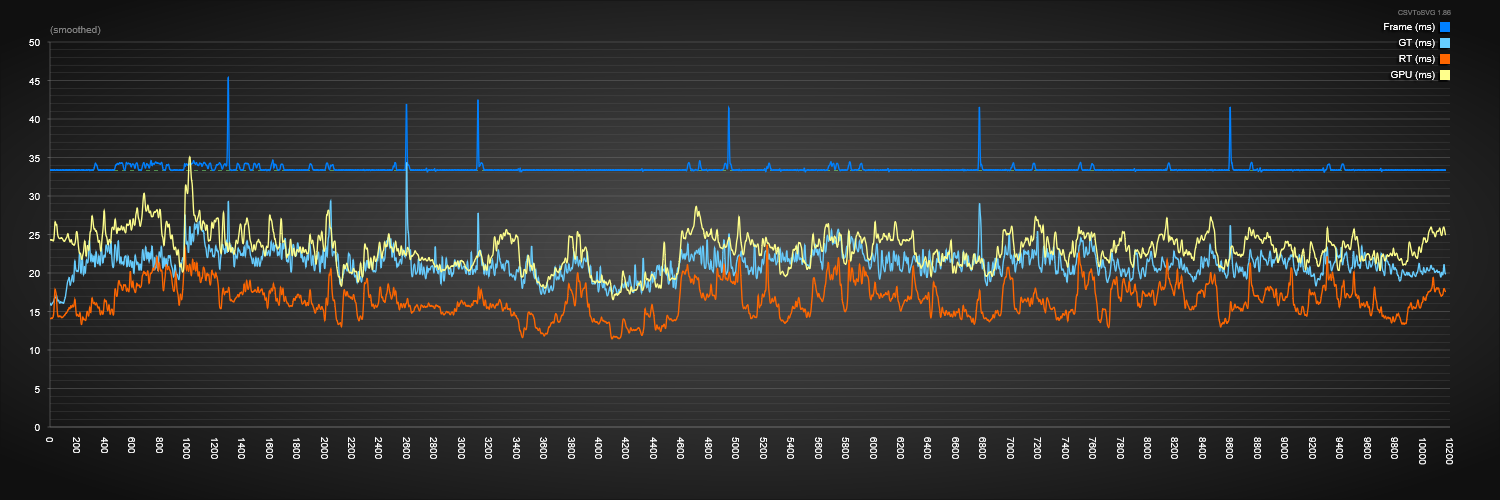
CSVToSVG is a commandline tool that can be used to make scalable vector graphics (SVG) line or stacked graphs from comma-separated value (CSV) files. It can graph any numerical stat, including multiple stats in a single CSV or a single stat across multiple CSVs or a directory of CSVs, with support for smoothing and budget lines. The data can be generated by either the StartFPSChart and StopFPSChart commands or using the CSV Profiler.

The CSVToSVG executable can be found in the following location:
[UnrealEngineDirectory]/Engine/Binaries/DotNET/CSVTools/CSVToSVG.exe
The source files can be found here:
[UnrealEngineDirectory]/Engine/Source/Programs/CSVTools/CSVToSVG
Required arguments
| Argument | Description |
|---|---|
| -csvs [list] OR -csvDir [path] | Specifies a list of CSVs separated by spaces, or a directory. |
| -o [svgFilename] | Sets the filename for the SVG output. |
| -stats [stat names] | Specifies a list of stats. This can use wildcards. For example: -stats renderthread/* |
Optional arguments
| Argument | Description |
|---|---|
| -skipRows [n] | Skips a specified number of rows in the CSV. This is useful for CSV file sgenerated from the FPSChartStart command, where there's a 4-row summary at the top. |
| -minX [value] -maxX [value] -minY [value] -maxY [value] | Clamps the X and Y range of the source data. |
| -smooth | Smooth the graph. |
| -smoothKernelSize [numFrames] | Specifies the smoothing kernel size in column entries to use. |
| -smoothKernelPercent [percentage] | Specifies the smoothing kernel size as a percentage of the graph length. |
| -legend [list] | Override the legend, otherwise this will be computed automatically. |
| -width [value] -height [value] | Specifies the width and height of the image. |
| -title [name] | Sets the title for the graph. |
| -noMetadata | |
| -graphOnly | Render just the graph, no borders. |
| -budget [ms] | Sets the budget line. Default is 33.3. |
| -thickness [multipler] | Sets the line thickness of the graph. |
| -theme [dark/light] | |
| -showEvents [names] | Draws event markers for the specified events, if the CSV has an events column. This can include wildcards. |
| -threshold [value] | Ignores stats which are entirely under this threshold. |
| -stacked | Makes a stacked graph for cumulative stats. |
| -stacktotalstack [stat name] | Specifies the total stat. Valid for stacked graphs only. |
| -ignoreStats [list] | Specifies a list of stats to ignore. This can include wildcards. |
| -interactive | Adds an interactive frame marker. |
| -colourOffset [value] | Rotates the colours. |
| -averageThreshold [value] | Ignores stats whose average is under this threshold. |
| -maxHierarchyDepth [depth] | When using stats with hierarchy, such as renderthread/initviews, specifies a max depth to traverse. |
| -hierarchySeparator [character] | Specifies a separator character for heirarchies (e.g "/"). |
| -hideStatPrefix [string] | Hides a prefix from the legend when displaying stats, e.g "gpu/". |
| -compression [pixel error value] | Enables lossy compression for SVG data. |
| -showaverages | Shows stat averages next to the legend and sorts the stats in the legend high to low by average value. |
| -hideEventNames [1/0] | |
| -showAllEventNames [1/0] | |
| -highlightEventRegions [startEventName,endEventName] | Event controls (see -showevents). |
| -discardLastFrame [1/0] | Discards the final frame of data which is often invalid. On (1) by default. |