The editor features the Animation Insights plugin to visualize gameplay state and live animation behavior. Animation Insights enables users to record trace information to visualize animation behavior with the following features:
- Channel filtering to select the trace data written out to the recorded data set
- Source filtering to select the gameplay objects that output trace data
- Pose, Curve, Blend Weight, Anim Graph, Montage, and Anim Notify tracks
- Schematic Anim Graph view with a live update that replaces the
showdebug animationsystem.

Setup
To begin using Animation Insights in the editor, enable these plugins:
- Animation Insights
- Insights Data Source Filters
- Trace Data Filtering
If you choose to enable these plugins from inside the editor, locate them in the Plugins tab under Editor > Plugins > Built-In. Otherwise, enable these plugins in the project's *.uproject file:
{
"FileVersion": 3,
"EngineAssociation": "4.25",
"Category": "",
"Description": "",
"Plugins": [
{
"Name": "TraceSourceFilters",
"Enabled": true
},
{
"Name": "GameplayInsights",
"Enabled": true
},
{
"Name": "TraceDataFilters",
"Enabled": true
}
]
}
After enabling the required plugins, restart the editor.
When the editor restarts, navigate Window > Developer Tools > Profiling to open Animation Insights and Trace Data Filtering.
After setting up filters with Trace Data or Trace Source filtering, live trace data will record and visualize in Animation Insights. Traces automatically write to the following project directory: <YourProject>/Saved/TraceSessions. Because trace sessions can grow in size over time, make sure to actively monitor and manage the *.utrace files.
Trace Data Filtering
The Trace Data Filtering minor tab initially opens next to the Content Browser. In Trace Data Filtering, users can set Trace Channel states to enable trace data by while the engine runs. After making filter selections, users may choose Filter Presets > Save User Preset. Currently, the editor provides a default Animation preset that currently enables Frame, Object, and Animation channels.
Channel filtering
With enabled channels, data will trace to the timeline in the Animation Insights minor tab.
Play-in-Editor (PIE) to view animation data trace out for skeletal mesh components in the scene
Trace Source Filtering
With Trace Source filtering, users determine the gameplay objects that can output trace data. If users are working on a large-scale game, there are a large number of Actors and Components in a given world. Trace Source filtering enables users to reduce the amount of recorded trace data, limit overhead, and reduce the amount of used disk space (for example, users may only have interest in the PlayerPawn or certain Actors within range of the Player).
To open the Trace Source Filter tab, select Menu > (Filtering) Trace Source Filtering in Animation Insights.
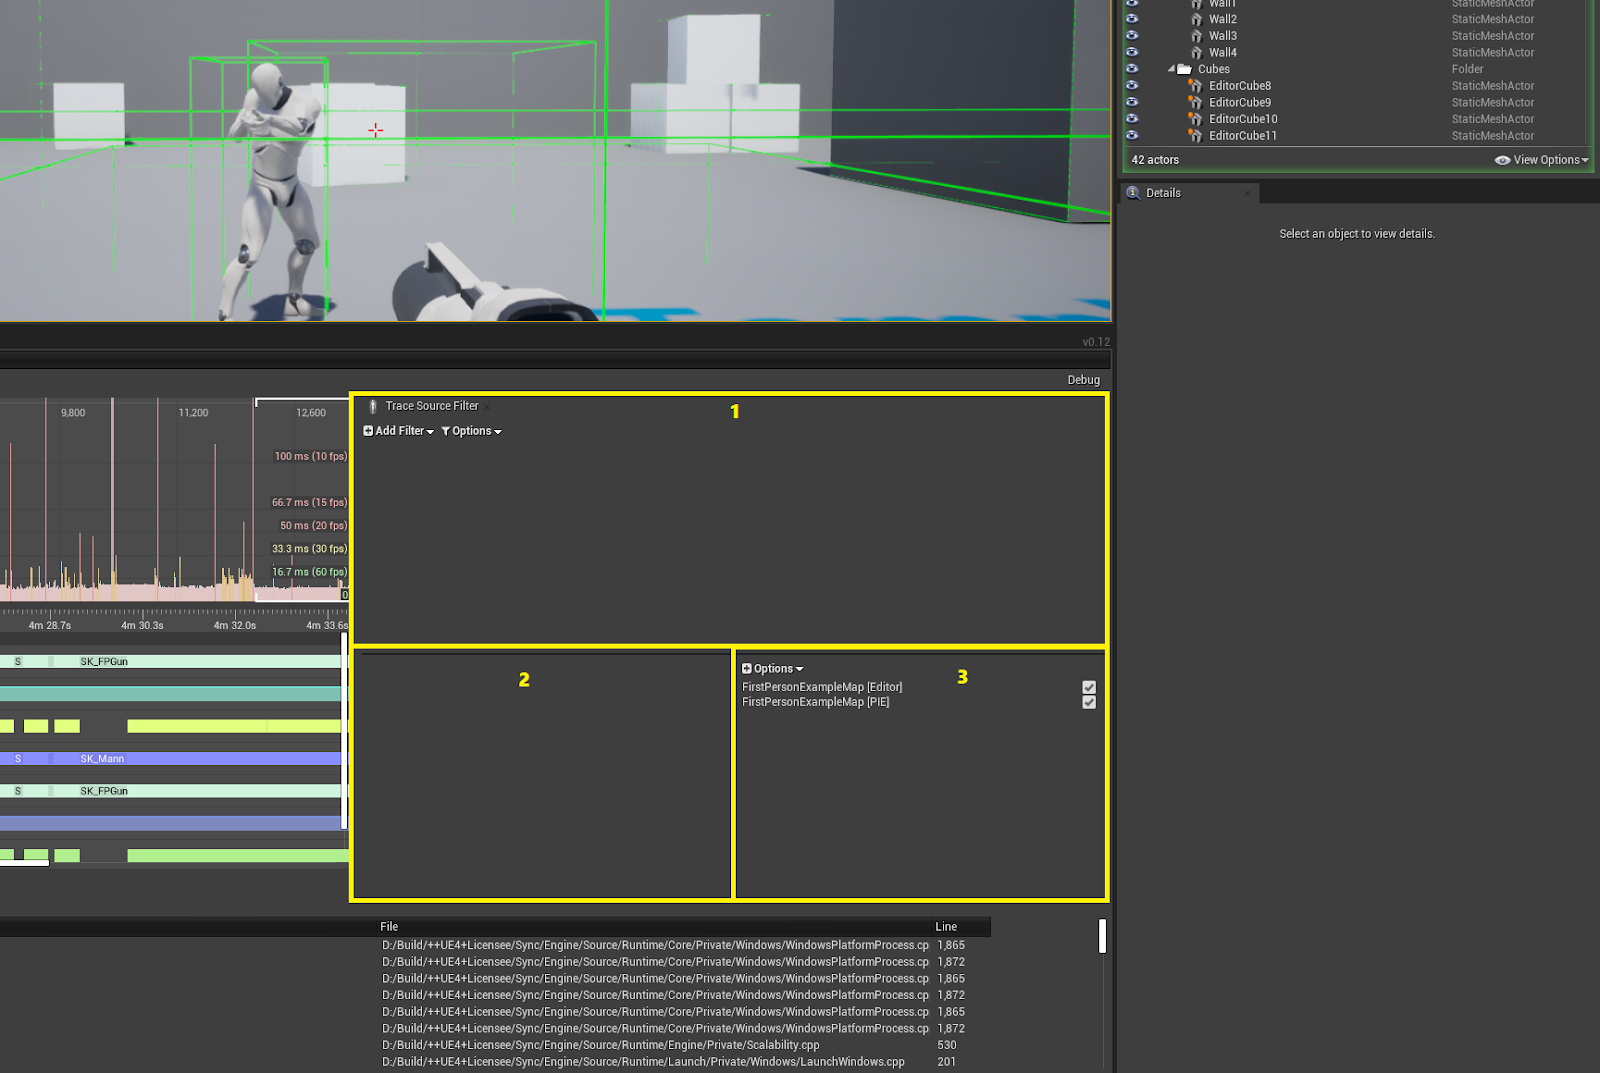
User Interface
| Number | Description |
|---|---|
| 1 | The Add Filter dropdown enables users to add and combine user-created filters with AND, OR, and NOT logical operators. Use Options to visualize each Actor it's individual filtering state, reset the current filters, and to save or load filter presets. |
| 2 | Context sensitive region to set filter variable values. |
| 3 | The Options dropdown allows users to enable world filtering by World Type (Editor, PIE or Game) or by World Net Mode (Client, Server or Standalone). |
The following animation shows the Trace Source Filtering in action:
Animation Insights
Animation Insights expands on the preexisting showdebug animation feature, which displays animation runtime internal data. The ability to visualize and analyze the information enables users to identify the cause(s) of animation glitches or bugs.
Over time, showdebug animation limited users' ability to track down animation problems because the showdebug animation system only outputs text to the screen. With Animation Insights, users can record the frame ranges containing the animation bugs while also having the ability to scrub (or play back) those frames while reviewing the data breakdowns.
Animation Insights schematic view with a live update—this replaces showdebug animation
Control Reference
| Input Shortcut | Function |
|---|---|
| Ctrl + Left Mouse Button Drag over Time Ruler | Drags Time Ruler (above tracks view) to control the current time, allowing values to be scrubbed in schematic views, poses to animate in the viewport, and more |
| G | Toggle Graph visibility |
| V | Auto-hide tracks that have no timing events in the current Viewport |
| I | Toggle I/O (File Input) Overview and Activity Track visibility |
| L | Toggle Asset Loading track visibility |
| Y | Toggle GPU track visibility |
| U | Toggle CPU Thread (and all CPU thread group) track visibility |
| R | Toggle Frame track visibility |
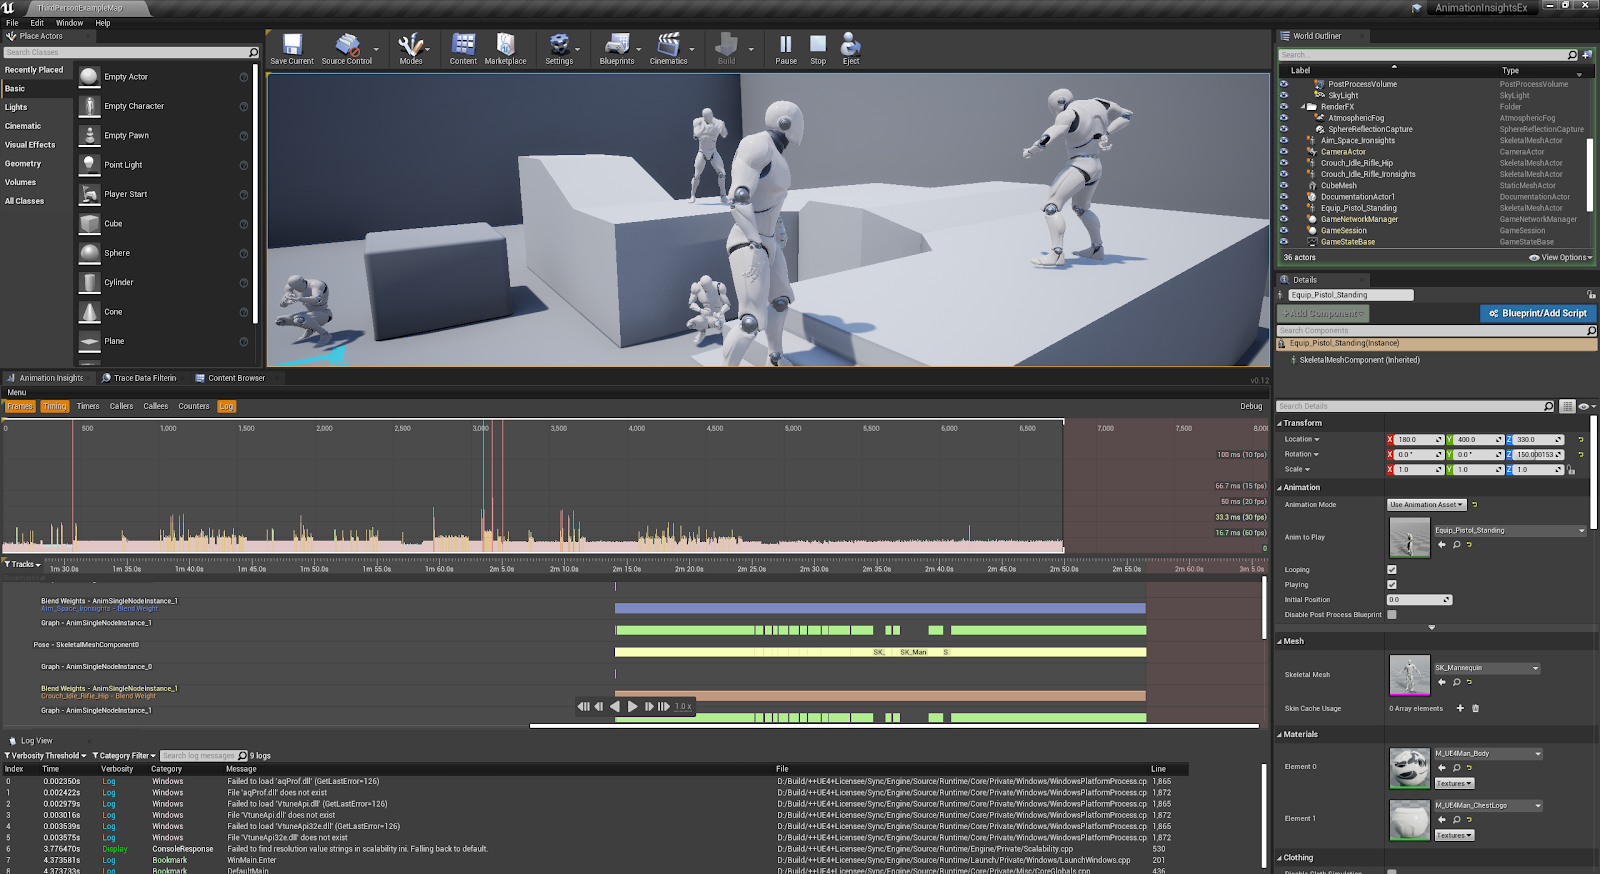
User Interface
| Number | Description |
|---|---|
| 1 | Animation Insights menu that enables users to display Timing Insights tracks (such as Counters or Frames). Additionally, users can open the Trace Source Filtering Panel from this menu. |
| 2 | Frames panel |
| 3 | Timing panel with Track grouping and filtering options. See below to view the available track types. |
| 4 | Context menu enabling users to view specific properties, visualization styles (like polygons or points), series data, track layouts, and track sizes. |
| 5 | Transport controls enable users to play back a recorded session and step frames. |
| 6 | Schematic views that display properties of each track. These change over time while scrubbing the ruler. |
Track Inspection
To inspect a track for debugging or performance analysis, right-click the track and follow its context menu to learn more about the track.
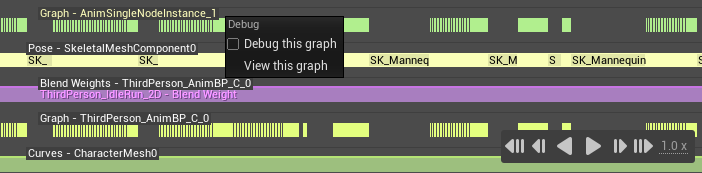
Right-clicking Graph - AnimSingleNodeInstance_1 opens the Graph Track context menu.
Animators typically need to identify problem spots in their animations, and Animation Insights helps the debugging process by enabling animators to visualize Notifies, Curves, Pose, Graph, Montage, and Blend Weights.
Track Types
Each track type features its own context menu, which is the main entry point for per-track operations (for example, the Pose Track menu allows poses to be enabled or disabled for viewport rendering). Some tracks have common context menu options. For instance, tracks that display graphs allow graphs to be scaled, series to be toggled, stacked/overlay views and more.
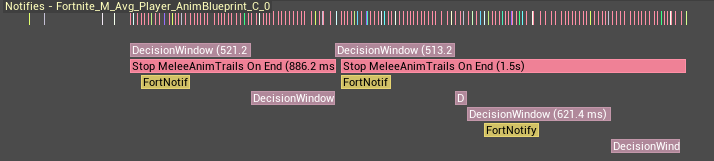
Notifies
Notifies tracks display animation about notifies and sync markers. The topmost lane of the track displays the per-frame events, such as ticks, notify events (example, for audio and effects) and sync markers. Other lanes display the active notify states. Right-click the track and select View Properties to display the notifies that are active on the current frame.
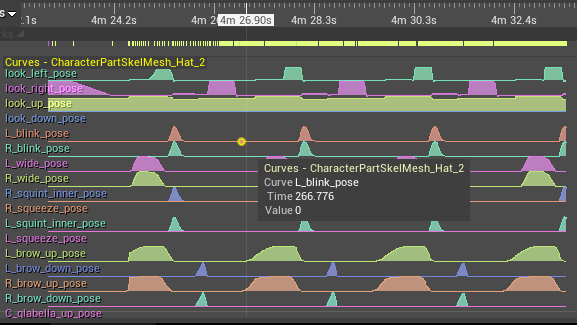
Curves
Curves tracks display all curves that were active in a frame. Right-click and select View Properties to see the curve values that were active on a given frame.
Pose
Pose tracks enable users to show or hide Actor poses while scrubbing the timeline.

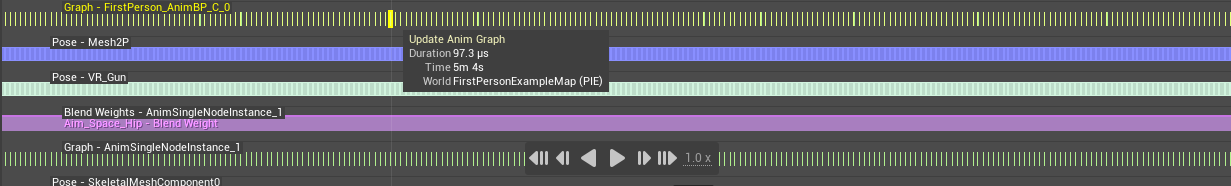
Graph
Right-click and select Debug this graph to open the Animation Blueprint debugger and connect it to the track. With the Animation Blueprint debugger open, scrub the timeline to view the graph in action, including pose link weights, state machine states, asset player positions and blendspace samples. Select View this graph to see a schematic 'tree' view of the animation graph.
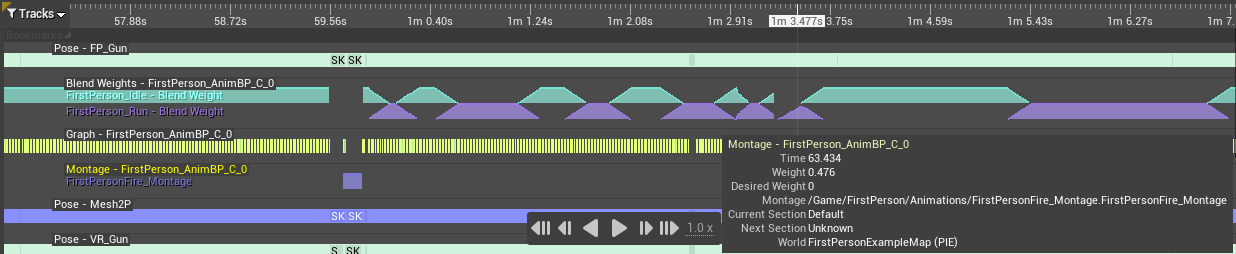
Montage
Montage tracks enable users to inspect Montage information over time, including blend weights and current/next sections.
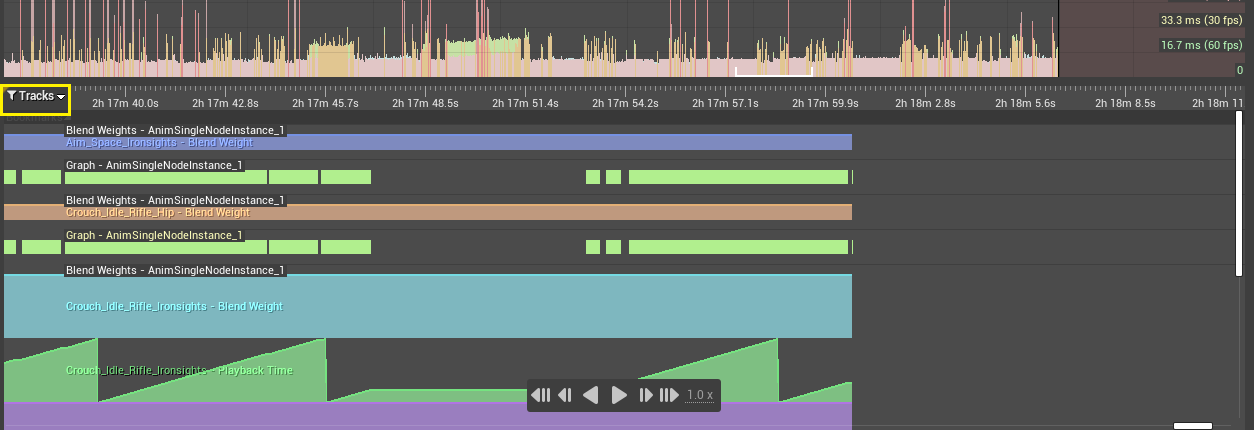
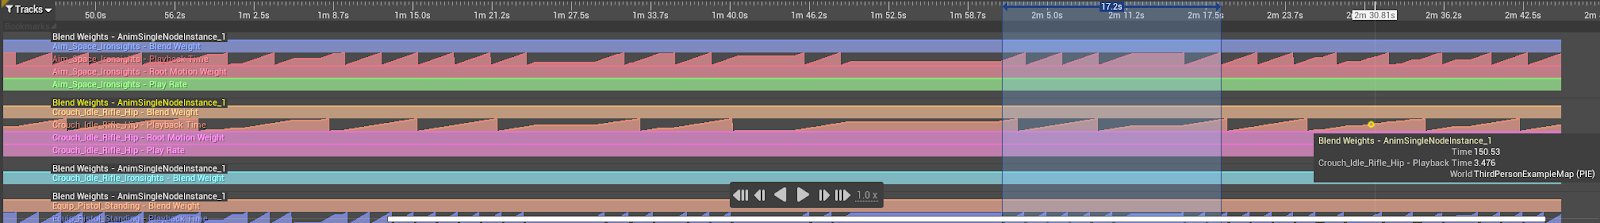
Blend Weights
Blend Weights tracks show all the assets that were active in a frame and their effective blend weights. Right click on a graph to go to the node in the Animation Blueprint that the graph corresponds to. You can also view other graphs such as playback time or blendspace coordinates.
Track Visibility
Use the Tracks dropdown filter to toggle timing track visibility.