Unreal Engine 4 has a set of CPU and GPU profiling tools that will help drill explicitly into what is costing time in your project.
For CPU profiling, you can drill into specific events and timings using the CPU profiling tool, which connects to a remote process.
For GPU profiling, there are more options. First of all, and most specifically, there's Unreal Engine 4's GPU profiler, which can be brought up with
Ctrl + Shift + Comma in editor builds running with -game emulation.
Additionally, you could go further drilling into more systemic problems using both GPUView and Nsight.
Oculus PerfHud
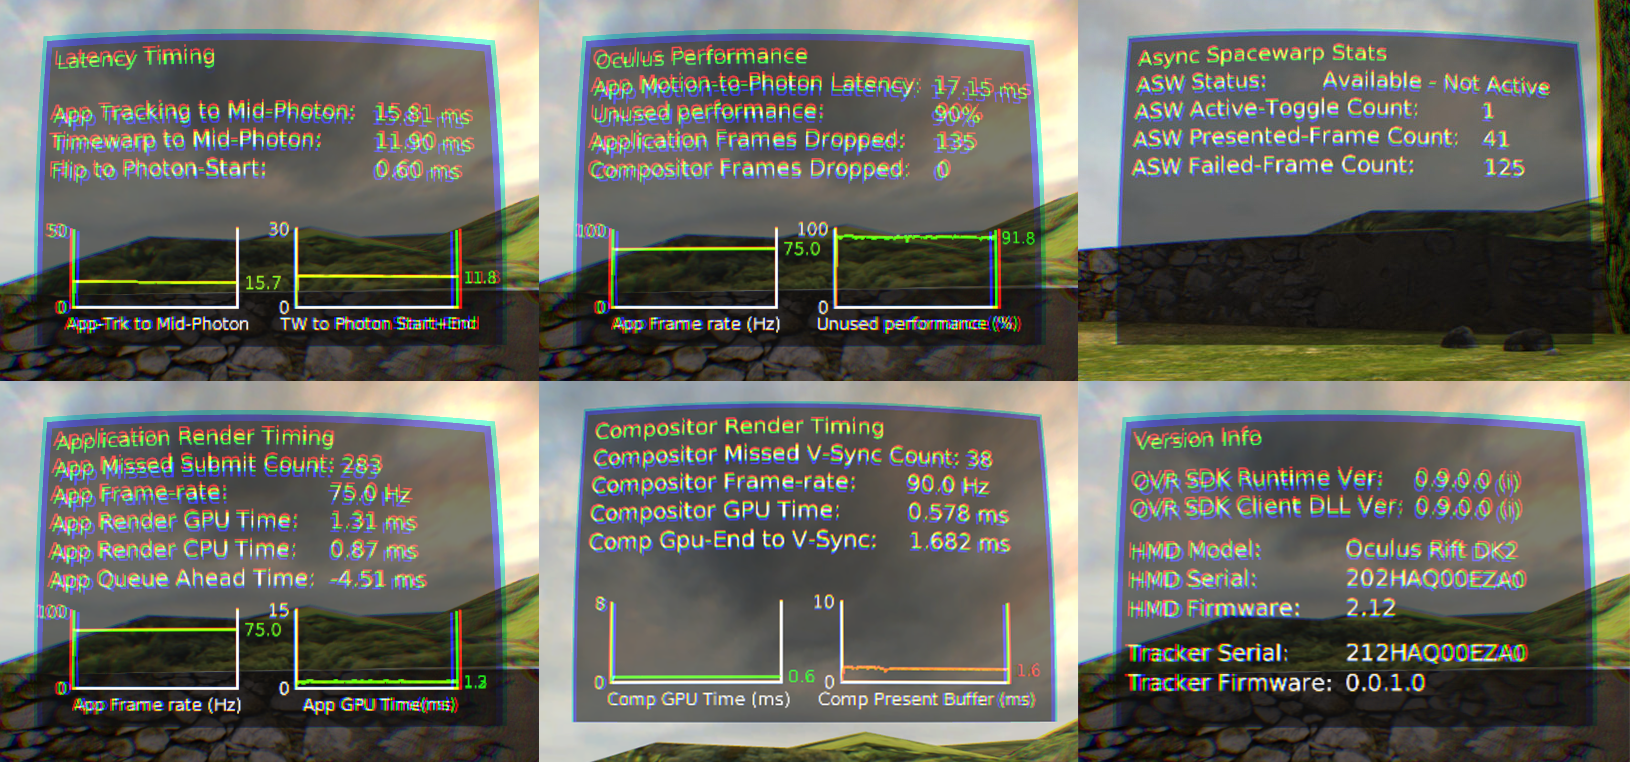
Oculus PerfHud is a tool that can be used to display performance information, whether in the editor or a packaged build. This tool will help verify the actual CPU and GPU timings, excluding any throttling done by the application. There's a great overview of the screens and what the values mean in Oculus' documentation.
In general, you'll want to look at the graphs and values on the Application Render Timing screen. These will give you the CPU and GPU timings as the Oculus compositor sees them, and will be more accurate for Draw and GPU timings.
To use Oculus PerfHud with Unreal Engine 4 (UE4), you will need to do the following:
-
First, go to
C:\Program Files\Oculus\Support\oculus-diagnosticsand locate the OculusDebugTool.exe.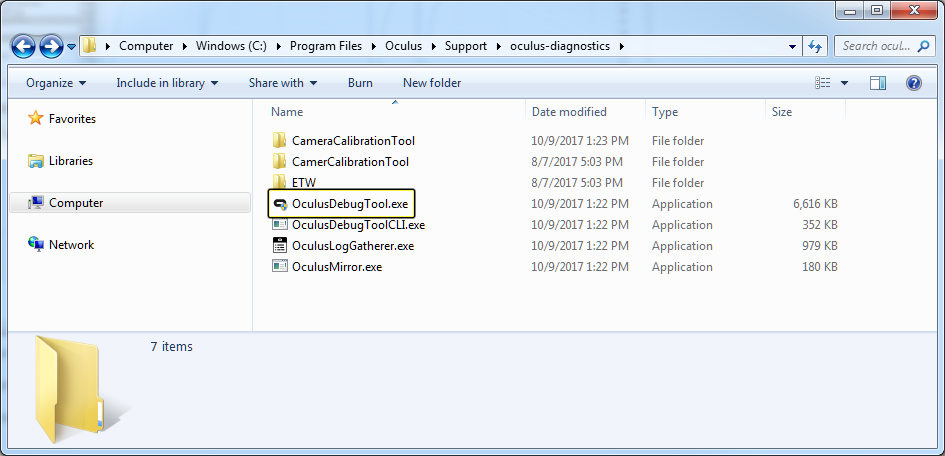
-
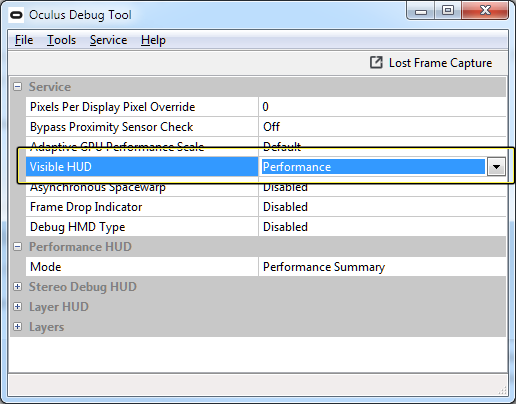
Double - click on the OculusDebugTool.exe to open it up and set the Visible HUD to the Performance option.
-
Now launch your UE4 project and put your Oculus Rift HMD on and you will see the performance information related to your UE4 project being displayed on the Rift. To change what type of information is displayed, you will need to change what is input into the Visible HUD option like in the image below.
SteamVR Frame Timing Tool
The SteamVR Frame Timing will allow you see how your VR project is performing in both the UE4 Editor or in a packaged build. This tool will help verify the actual CPU and GPU timings, excluding any throttling done by the application. There's a great overview of how to open the tool as well as what all of the values relate to on the Valve Developer Community page. Please note that there is nothing inside of UE4 that needs to be done in order for the SteamVR Frame Timing tools to work. All of the tool functionality and use is done from the SteamVR Application.
Please note that there is nothing inside of UE4 that needs to be done in order for the SteamVR Frame Timing tools to work.
RenderDoc
RenderDoc is an external tool you can also use for profiling Unreal Engine projects. To use it with UE4:
- Download the latest RenderDoc.
- In RenderDoc, configure it to launch your game (e.g. UE4Editor.exe, with appropriate command line arguments).
- Run
ToggleDrawEventsfrom the command line of your app to get human readable events. - Press F12 to capture a frame.