
Unreal Insights identifies areas in your project that require optimization. It is a telemetry capture and analyzing suite that provides you the capability to capture events from the application at high data rates.
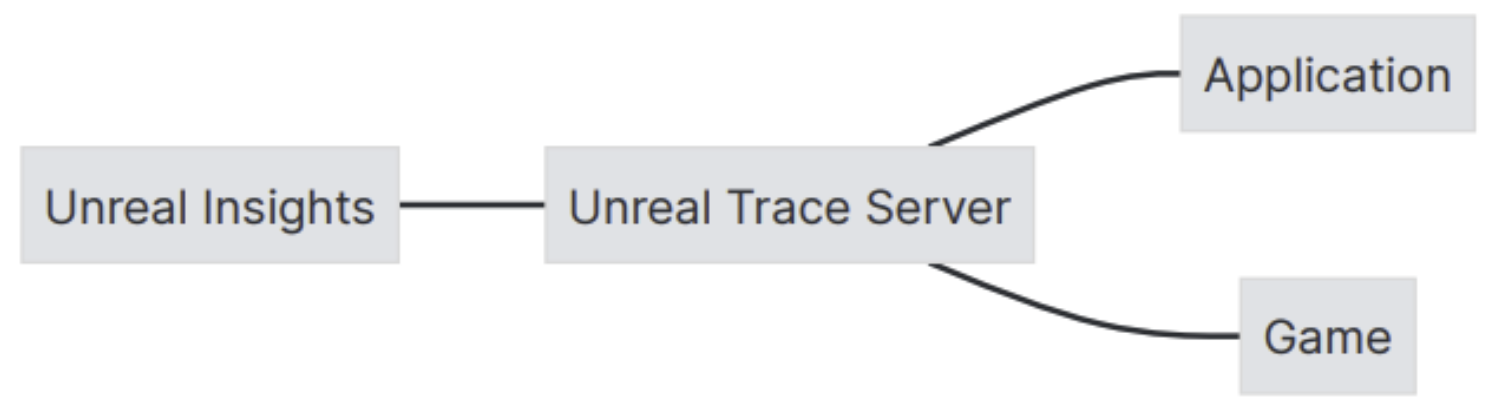
The major components of Unreal Insights consist of Trace events, the Unreal Trace Server which records and saves traces from the application, and Unreal Insights which analyzes and visualizes the data.
The stored trace sessions are self-describing and compatible between different engine release versions. They are stored in .utrace files. With generated companion data being stored in .ucache files next to the trace file.
Setting Up Unreal Insights
When building Unreal Insights you will have multiple options available.
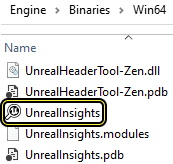
Option 1: Launch Unreal Insights from the Explorer
Check if you already have a prebuilt copy of Unreal Insights with your engine by navigating to Engine\Binaries\Win64\UnrealInsights.exe
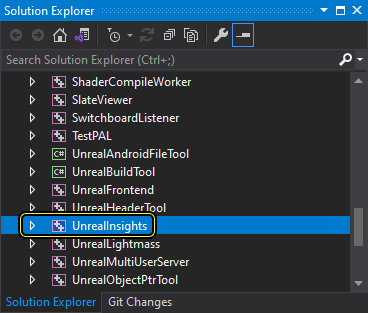
Option 2: Build from Visual Studio
You can build Unreal Insights from your Program's directory in your Solution Explorer.
Option 3: From the Command Prompt
Navigate to Start > Command Prompt then build Unreal Insights from your command directory.
cd C:\MyEngineInstallLocation\
Engine\Build\BatchFiles\RunUBT.bat UnrealInsights Win64 Development
Option 4: From the Editor
Start Unreal Insights from the Unreal Editor by navigating to Tools > Unreal Insights > Run Unreal Insights. Insights will attempt to compile automatically.
When running a Trace to profile your project data, you have multiple workflow options available depending on your Unreal Engine build and operating system. Refer to Trace and the Trace Quick Start Guide for additional documentation.
Trace
Trace is a structured logging framework for tracing instrumentation events from a running process.
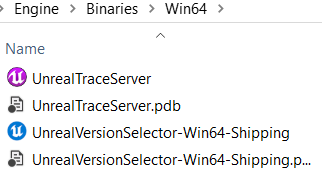
The Unreal Trace Server is run in the background as a single server instance and can be shared between multiple projects or branches. It is a lightweight program that has minimal impact on performance and does not include a User Interface. It is launched by a separate server process executable UnrealTraceServer.exe located in the Engine/Binaries/Win64 directory folder.
The Trace Server has two functionalities:
-
The Trace Recorder listens on port 1981 for incoming trace connections and records the live trace stream.
-
The Trace Store stores the recorded traces as files to a path like
C:/Users/<user>/AppData/Local/UnrealEngine/Common/UnrealTrace/Store/001/. It watches this folder for changes and exposes the list of available traces to Unreal Insights UI.
Refer to the Trace, Trace Quick Start Guide, and the Trace Developer Guide for additional documentation.
Unreal Insights Session Browser
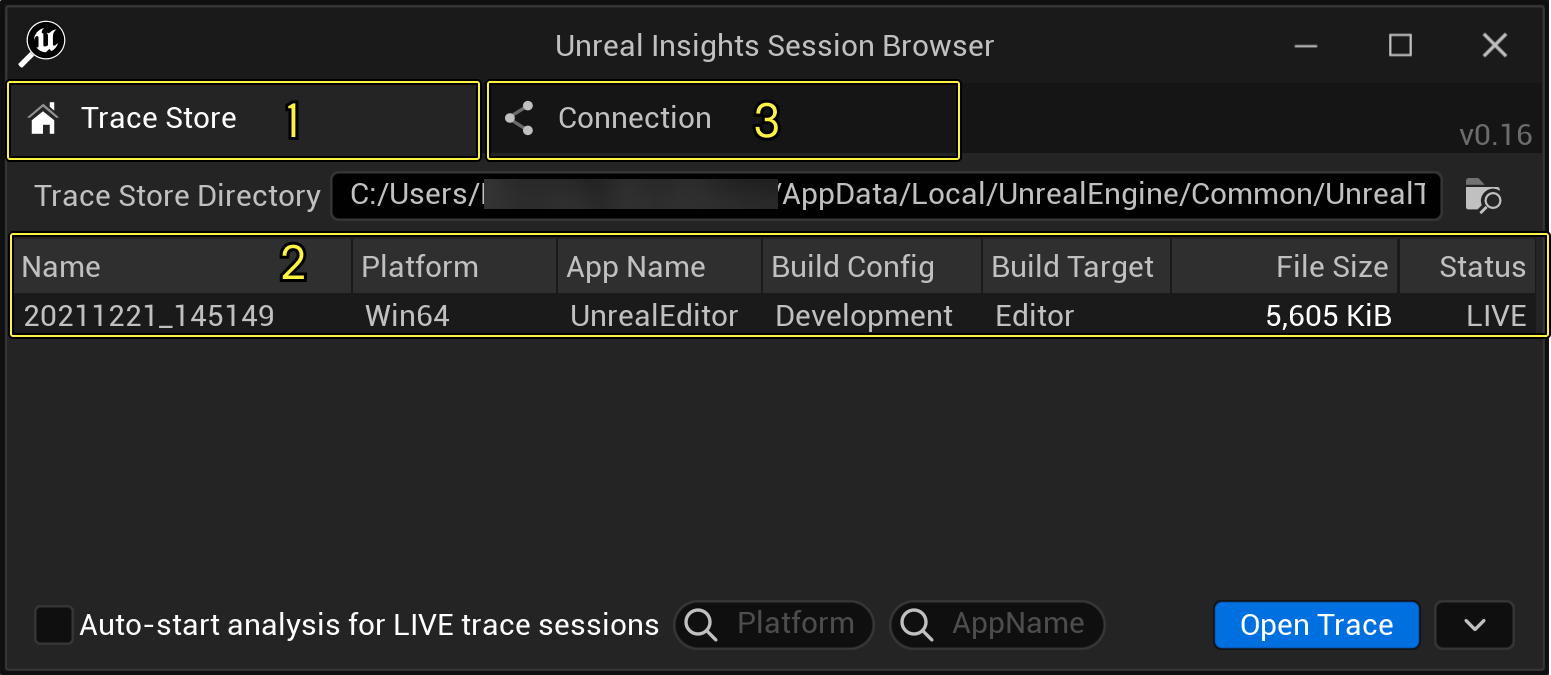
After starting Unreal Insights, it will open the Unreal Insight Session Browser, which contains the Trace Store panel (1), a directory which contains the Trace Sessions (2), and a Connection menu panel (3).
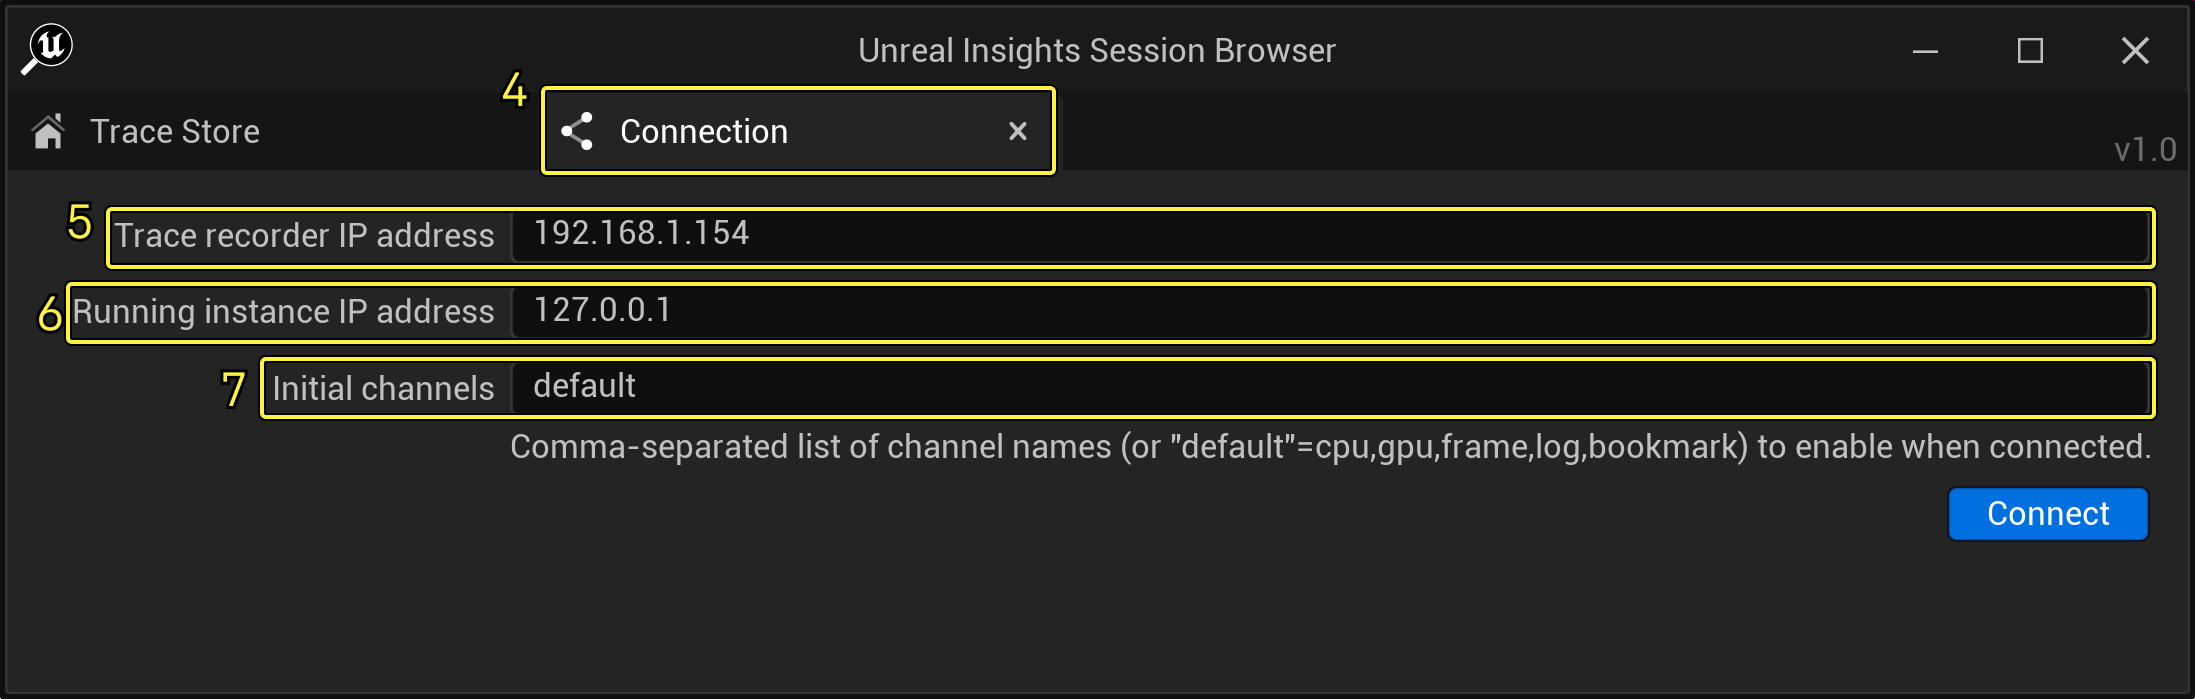
The Connection menu (4) contains a Trace Recorder IP address (5), a Running Instance IP address (6), and an Initial channel to enable specific traces when connected (7).
When the tool starts up, the Unreal Insights window opens first. In the top section of the window, labeled Trace Sessions, you will see a list of all pre-recorded sessions that you can load for analysis. These correspond to the .utrace files in your Trace Store Directory. You can double-click any of these trace sessions, or select a trace session and click Open Trace. Alternatively, you can search for .utrace files in other locations by using the Open Trace dropdown arrow.
To immediately start an analysis of a respective trace file, drag and drop a .utrace file from Explorer over the Unreal Insights window.
If a live Trace session connects to the tool, it will also appear in the list. Live sessions have the word LIVE in the status column, and update in real time while you analyze them, but are otherwise identical to pre-recorded sessions. The tool can connect multiple sessions at the same time, and it will automatically record data for all of them as the data streams in. You can analyze these sessions in real time by loading them from the list (just as you would with pre-recorded sessions).
Timing Insights Window
The Timing Insights window collects performance data. you will see per-frame performance data for different tracks along the CPU and GPU tracks. A new toolbar was added to the Timing view, splitting the Tracks drop down menu into multiple menus where you can look at different visualizations of the time your project spends on various tasks.
You can select blocks of time to view in aggregate, sort or categorize data, and review log output. You can show or hide the respective panels.
The Timing Insights window features the Frames panel (1), the Timing panel filters (2), the Timing panel (3), the Log panel (4),Timers and Counters tabs (5) and the Callers and Callees panels (6).
See Timing Insights for additional documentation.
Memory Insights
Memory Insights is a new component that provides you the capability to investigate memory usage and call stack tracing in your project.
The runtime component traces events for every allocation, reallocation, or free event that occurs during runtime, then reconstructs that memory usage pattern during analysis.
Refer to the Memory Insights documentation for instructions on how to set up, trace, query, and sort your data.
Networking Insights
Unreal Insights includes Networking Insights to analyze, optimize and debug network traffic.
Refer to the Networking Insights for additional documentation.
Reference
To get the most out of the many features that ship with Unreal Insights, You can customize your project's output with macros and command-line options.
Refer to the Reference page for additional documentation.
Slate Insights
Slate Insights extends Unreal Insights to help developers improve the performance of their UI by providing tools to identify the root cause of a specific Slate and UMG update.
Refer to the Slate Insights page for additional documentation.