
Unreal Engine 5 (UE5) expands the capabilities of Unreal Insights by adding improved memory tracking and profiling support into its Memory Insights feature. Developers can now see more detailed information about memory allocation and deallocation, including the Low Level Memory (LLM ) tags and callstacks associated with each block of memory at any point in time. Memory Insights features a query system that can find live allocations at a certain point in time, recognize increases or decreases in memory usage, differentiate short-term and long-term allocations, and find memory leaks.
Recording a Session
To begin using Memory Insights to record a trace in the memory channel, follow the steps below:
Run or Build Unreal Insights
Navigate to Start > Command Prompt and enter the following:
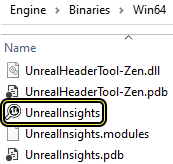
Engine\Binaries\Win64\UnrealInsights.exe
Alternatively, you can navigate to your Engine\Binaries\Win64 folder and double-click to run the UnrealInsights.exe.
Run Your Game Project with Memory Tracing
Launch the Command Prompt from your operating system and run your project sample:
cd C:\MyEngineInstallLocation\
Samples\Games\MyGameSample\Binaries\Win64\MyGameSample.exe -trace=default,memory
Recording a session of your project requires the memory trace channel to be active from the beginning of the process. Otherwise, it won't be possible to start tracing allocation events in a late-connect session. Additionally, if you're running a trace on a packaged project, you need to ensure that it is packaged in Development mode.
Open your Trace from the Insights Session Browser
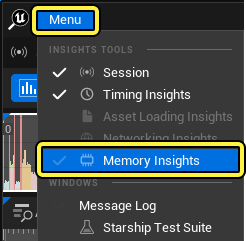
Navigate back to the Unreal Insights Session Browser, then double-click your .utrace file to open it for analysis in the Unreal Engine Timing Insights window. Select Menu > Memory Insights to open the Memory Insights window.
Memory Allocation - Graph Tracks
Unreal Insights captures complete call stacks for each allocation event to provide you with an analysis of your project's allocated memory.
The main interface for Memory Insights consists of a timeline showing an overview of memory usage during the session.
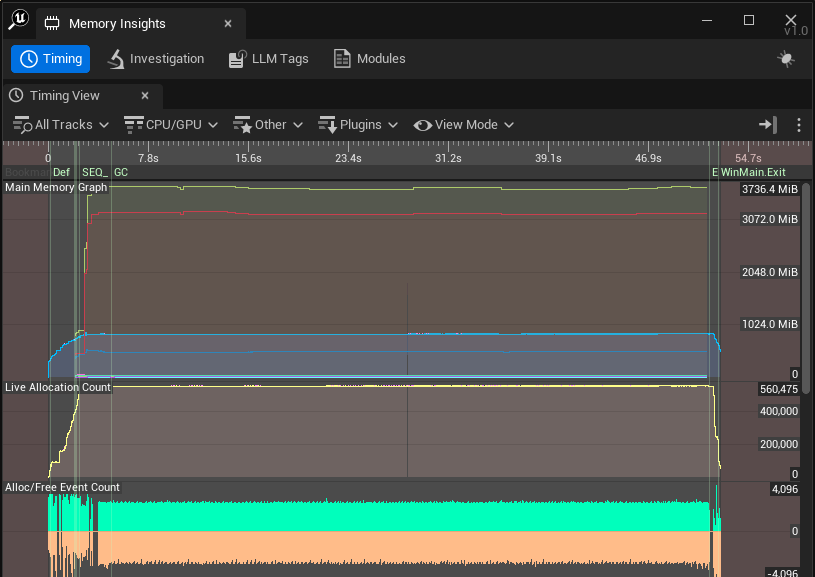
The Memory Insights tracker shows information about the number of live allocations in memory. Pictured above is the Main Memory graph along with the Live Allocation and Free Event Count.
Unreal Insights captures complete call stacks for each allocation event to provide you with an analysis of your project's allocated memory.
The Main Memory Graph shows the total amount of tracked memory in your project, including information on each tag that is gathered from the LLM. Additionally, there are graphs that display the total number of live allocations:
| Graph Type | Color | Description |
|---|---|---|
| Total Allocated Memory | Blue | Shows the total amount of memory allocated at each point in time, based on detailed allocation tracking. |
| Live Allocation Count | Yellow | Shows the total number of active allocations at any point in time. |
| Allocation/Free Event Count | Green/Orange | Shows the number of allocation and free events per unit, which is represented as a "slice" of time. |
Each of these graphs is based on detailed allocation tracking. They start at a time value of 0 and have a granularity of approximately 1ms. The other graphs with the LLM prefix tags(RenderTargets, SceneRender, UObject) are based on a Low-Level Memory tracking runtime system.
These tags will start tracking several seconds after the session has started and contain a per-frame granularity.
By default we emit one timestamp at each 4096 allocation / free event, You can change this amount if needed by modifying the MarkerSamplePeriod located in Engine/Source/Runtime/Core/Private/ProfilingDebugging/MemoryAllocationTrace.cpp. For example, setting this variable to a value of 0 will emit a timestamp after each allocation / free event.
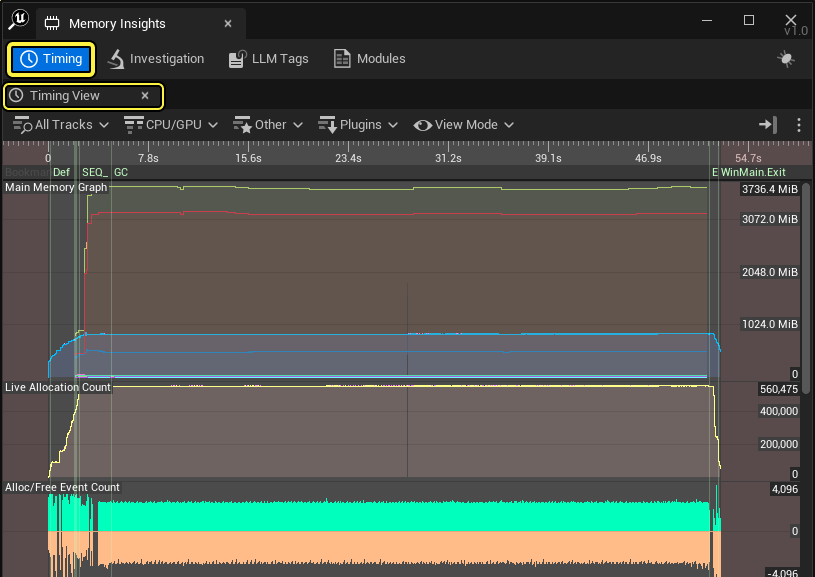
The Memory Insights timeline supports overlaying tracks onto the Timing View. When using the Memory Insights view there are four panels available, the Timing, Investigation, LLM Tags, and Modules panels.
Timing View
You can click Timing to toggle the display of the Timing View window. Here you can observe and filter the performance data of different tracks relating to memory usage.
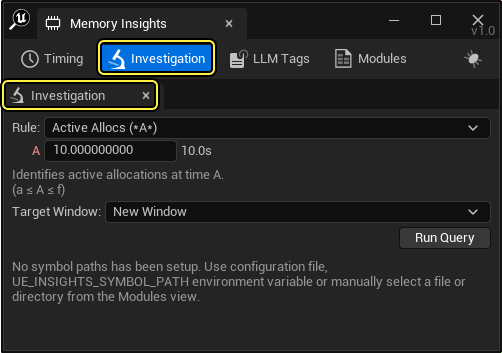
Investigation Panel
The Investigation panel lets you make different queries about allocations.
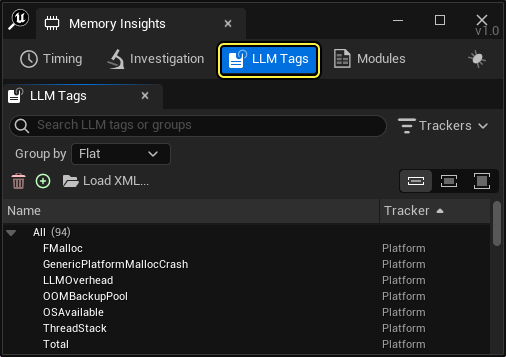
Low-Level Memory(LLM) Tags
The LLM Tags panel controls the visibility of different LLM tags. This data is traced directly from your operating system.
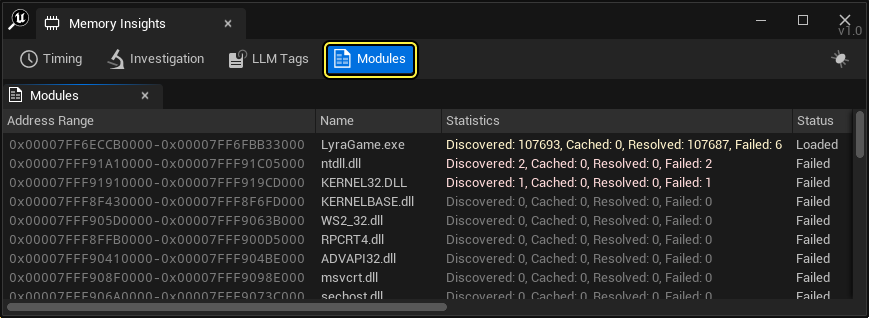
Modules
When call stack symbols are resolved, the result is stored in the cache file. You can view these files by clicking Modules. This panel lets you open old trace files and use symbols.
The previous runtime implementation of memory tracking is implemented in the LowLevelMemTracker class located in the folder Engine\Source\Runtime\Core\Public\HAL\LowLevelMemTracker.h. Both the LLM Tags panel and the LLM graphs use data traced directly from this system. The detailed allocation data comes from a separate and specific trace implementation.
Memory Insights contains new querying features and tracked memory allocation information. You can identify blocks of memory that UE5 allocates and frees within certain time windows, before or after a specific moment in time, or check for memory leaks. You can access the query system by going to the Investigation tab after opening a trace log.
Investigation - Allocation Queries
While the timeline provides an overview of memory usage, evaluating how individual allocations behave over a span of time is done by using "queries". A Query is defined by a Rule and one or more Timestamps, such as the labels A and B.
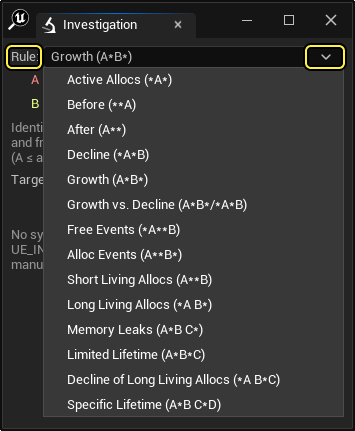
The Investigation panel contains query rules to evaluate data.
The available Query Rules are as follows:
| Query Rule | Time Variable | Description |
|---|---|---|
| Active Alloc | A | Displays all active allocations at time A. |
| Before | A | Displays all allocations before time A. |
| After | A | Displays all allocations after time A. |
| Decline | A and B | Displays all allocations that were allocated before time A and freed between time A and time B. |
| Growth | A and B | Displays all allocations that were allocated between time A and B and freed after time B. |
| Growth Vs Decline | A and B | Identifies both "growth" allocations (allocated between time A and time B and freed after time B) and "decline" allocations (allocated before time A and freed between time A and time B). The decline allocations are changed to have a negative size, so the size aggregation shows variation between A and B. The result of this query is a comparison of what was allocated at time A with what was allocated at time B. A grouping of memory allocations by tags or call stack will show variation (B - A) for each group. |
| Free Events | A and B | Displays all allocations that were freed between time A and B. |
| Alloc Events | A and B | Displays all allocations that were allocated between time A and B. |
| Short Living Allocs | A and B | Displays all allocations that were allocated after time A and freed before time B. This rule can be used to identify allocations that could be stack allocations, meaning that this identifies temporary or short-lived allocations. |
| Long Living Allocs | A and B | Displays all allocations that were allocated before time A and freed after time B. |
| Memory Leaks | A, B, and C | Displays all allocations that were allocated between time A and B and not freed until after time C. This is useful to find memory that would be expected to be released at a given time, for example during a level transition. |
| Limited Lifetime | A, B, and C | Displays all allocations that were allocated between time A and B and freed between time B and C. |
| Decline of Long Living Allocs | A, B, and C | Displays all allocations that were allocated before time A and freed between time B and C. |
| Specific Lifetime | A, B, C, and D | Displays all allocations that were allocated between time A and B and freed between time C and D. |
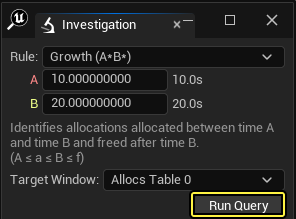
Queries are made by selecting a rule and dragging the labeled markers in the timeline to desired locations, or by specifying a time in the Investigation tab.
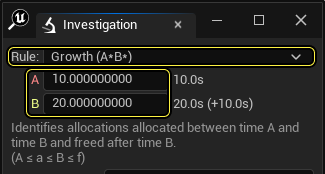
Once the desired rules and times have been selected press the Run Query button in the Investigation tab to make the query.
Depending on the query and data set that is being captured the queries may take a considerable amount of time to execute.
Allocation Breakdown View
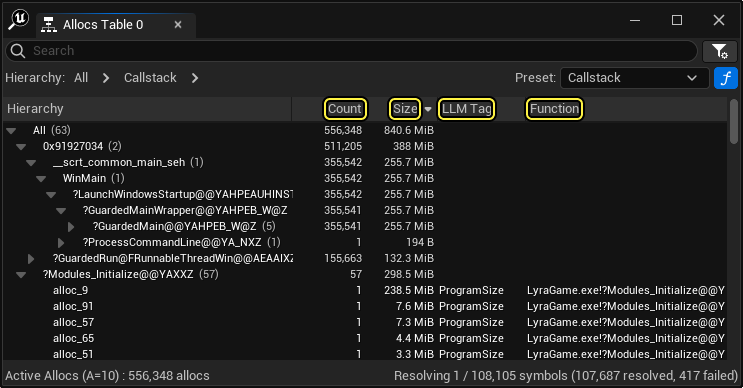
When the query is run a new window appears, upon completion of the query the Alloc table is populated with the result. By default, these results will be displayed in a flat list.
Each allocation is displayed with a Count, Size, LLM Tag, and the Function that made the allocations.
Hovering over the function or the information icon will display additional details and the full call stack.
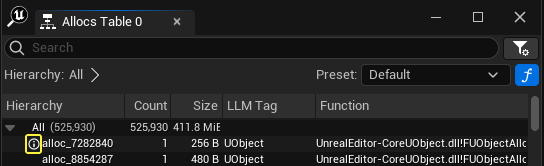
The full call stack is displayed when hovering over the Information icon.
Sorting
By clicking on the table headers, you can sort the list by different columns.
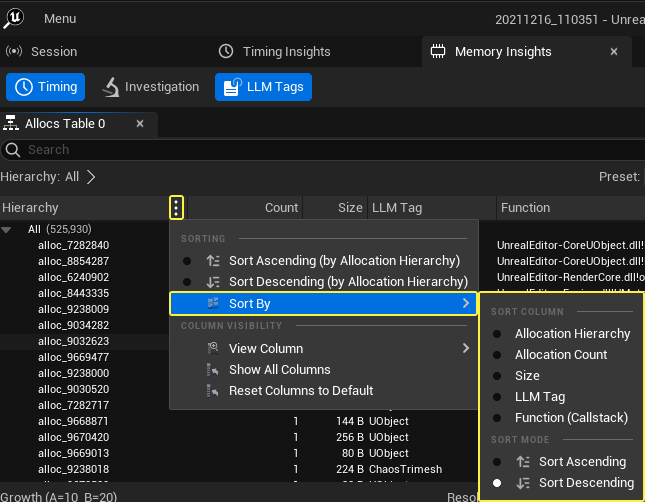
| Sort Column | Description |
|---|---|
| Allocation Hierarchy | Sorts by the hierarchy of the allocation tree. |
| Allocation Count | Sorts by the numbers of allocations. |
| Size | Sorts by the size of the allocations. |
| LLM Tag | Sorts by the LLM tag of the allocations. |
| Function (Callstack) | Sorts by the resolved top function from the call stack of the allocations. |
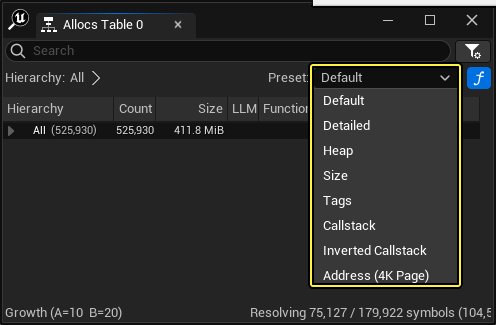
Grouping
| Default | Displays the default allocations |
| Detailed | Configures the tree view to show detailed allocation information. |
| Heap | Investigates how different types of memory are used. See Multiple Address spaces . |
| Size | Finds any large allocations quickly. |
| Tags | Displays the allocations per system. |
| Callstack | Investigates which call stack allocations are coming from. |
| Inverted Callstack | Configures the tree view to show a breakdown of allocations by Inverted Callstack. |
| Address(4k Page) | Groups allocations into 4k aligned memory pages based on their address.
|
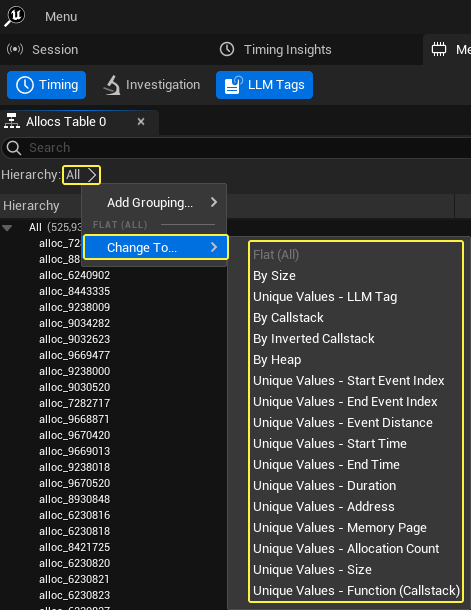
Preset options can be used to group allocations together.
Navigating to Hierarchy and clicking All will open a dropdown menu to change the default Flat view into additional, alternative groups.
Advanced Filtering
The search text box provides a method to quickly filter the result based on the hierarchical node text. The set of allocations produced by the query can be further filtered to isolate a group of allocations, by clicking Filter Configurator next to the search text box.
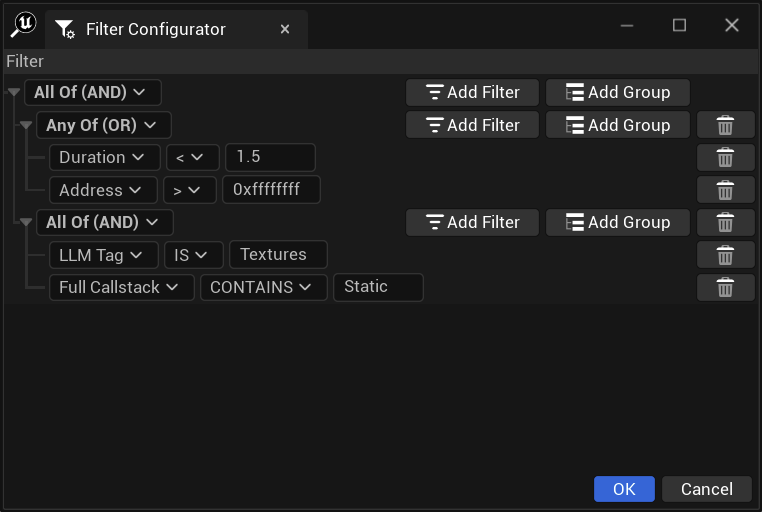
It is possible to build advanced queries using groups and AND/OR keywords.
Call Stack Symbol Resolving
Call Stack Symbol Tracing from your project is accomplished using program counter addresses. In analysis, these addresses need to be resolved to readable strings along with information about the corresponding source files.
This requires that Memory Insights has access to the correct version of the file containing the debug information. either a .pdb or .elf file (depending on the platform). Insights will search for the correct file according to the following list:
-
Any new paths entered by the user in this session.
-
Path of the executable (If available on some platforms, this will be compiled into the binary).
-
Paths from the
UE_INSIGHTS_SYMBOLPATHenvironment variable. This variable accepts semicolon-separated paths. -
Paths from the user configuration file.
When symbols are resolved, the results are stored in the cache file. You can view these files by clicking the Modules panel. You can then open these files by right-clicking your selected file and selecting one of the following options from the dropdown menu.
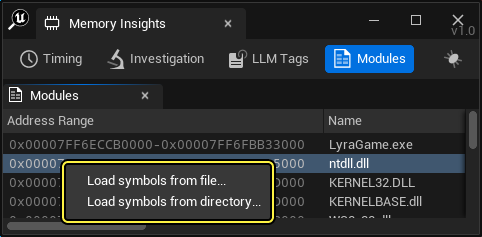
It provides you a method to send the trace file to other users without requiring them to have access to that debug information.
| Load Method | Description |
|---|---|
| Load symbols from file | Loads symbols for a module by specifying a file. If successful, it tries to load other failed modules from the same directory. |
| Load symbols from directory | Loads symbols for a module by specifying a directory. If successful, it tries to load other failed modules from the same directory. |
Multiple Address Spaces
Memory tracing tracks memory in different heaps. Conceptually, any allocation must belong to a root heap, representing one type of memory. For example, on desktop platforms, one root heap is the system memory and the other is the video memory on the graphics card. Each root heap has its own address space. Under each root heap, heap allocations are made that can host allocations. Usually, this means virtual memory allocations which back up allocations, however, block-style allocators can also be represented with heap allocations. This provides the investigation of the use of those blocks of memory.