The Timers and Callers panels show a list of events that occur within a highlighted range in the Timing panel. Each panel has similar controls, but displays different information for each event.
Timers
The Timers panel lists all timer events that run within the time range designated in the Timing panel. In addition to grouped data based on time range, the list can be sorted in ascending or descending order by the values in any active column.
| Group Name | Description |
|---|---|
| Flat | Creates a single group. Includes all Timers. |
| Timer Name | Creates one group for one letter. |
| Timer Type | Creates one group for each timer type. |
| Instance Count | Creates one group for each logarithmic range(1-10,10-100, 100-1000.) |
Plotting Events in the Main Graph
Double-click an event in the Timers Panel's list to highlight it. A colored box will appear next to it in the list, and the Main Graph will plot the event in the corresponding color. Double-click the event again to remove it.
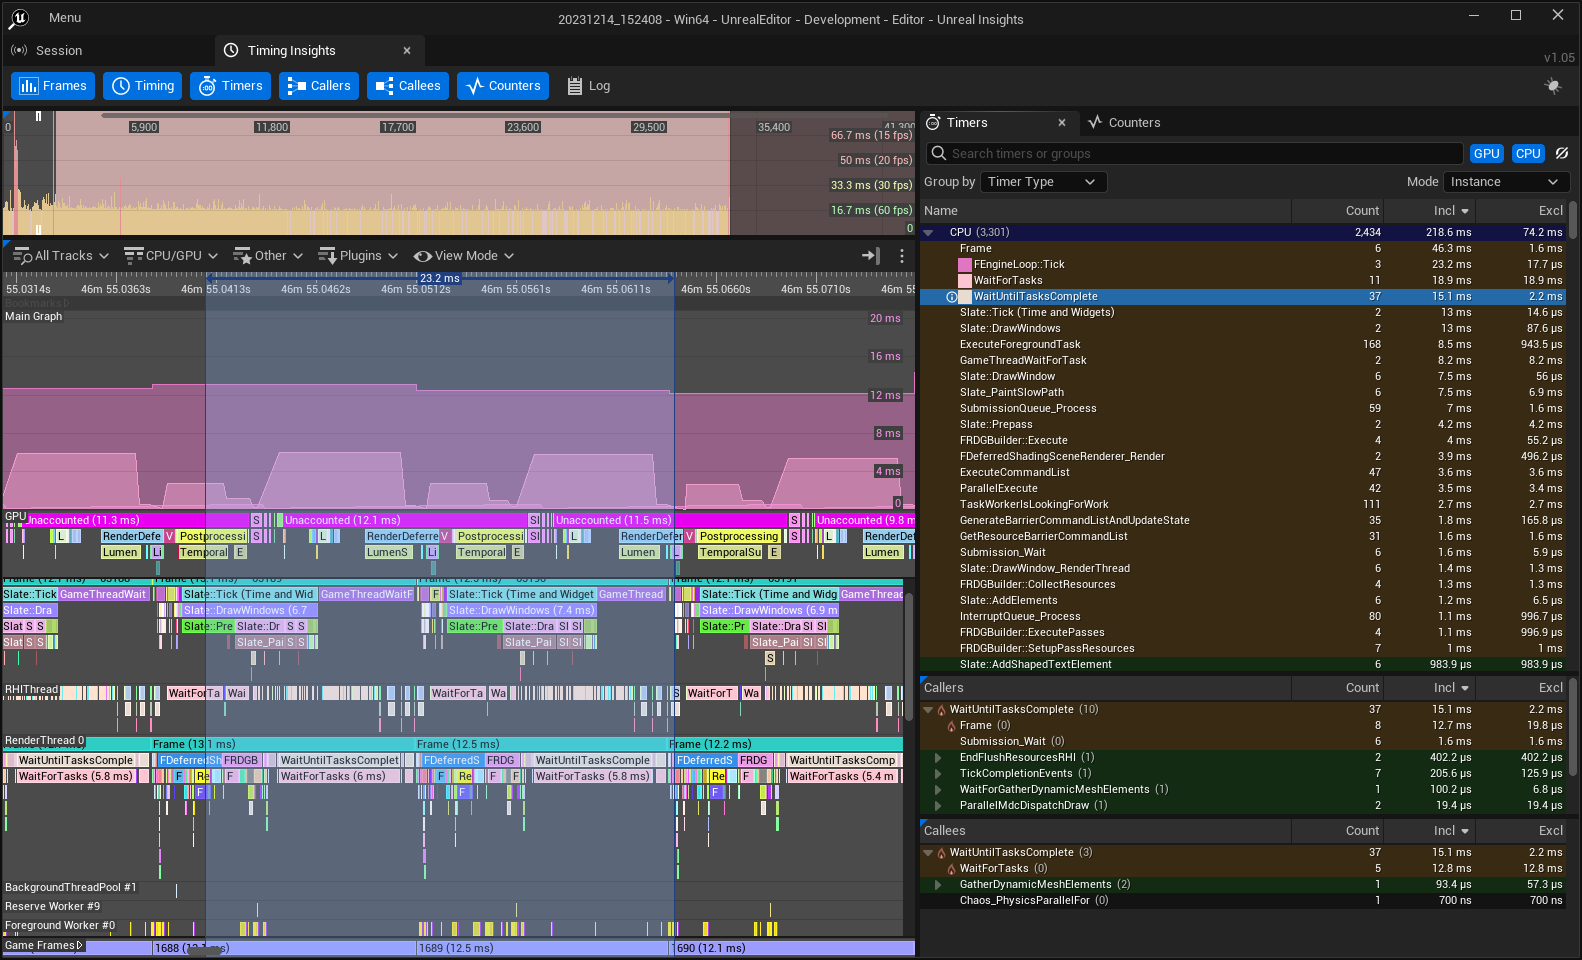
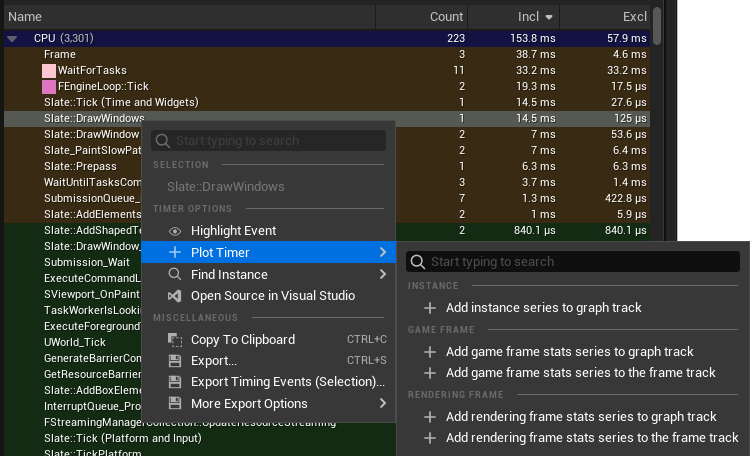
Right-click an event and navigate to the Plot Timer sub-menu for more options for plotting graphs.
| Option | Description |
|---|---|
| Add instance series to graph track | Plots all instances of the selected event on the Timers panel's main graph. |
| Add game frame stats series to graph track | Plots game frame information for the selected event in the Timers panel's main graph. |
| Add game frame stats series to the frame track | Plots game frame information for the selected event in the Frames panel's graph. |
| Add rendering frame stats series to graph track | Plots rendering frame information for the selected event in the Timers panel's main graph. |
| Add rendering frame stats series to the frame track | Plots rendering frame information in the Frames panel's graph. |
Aggregation Modes
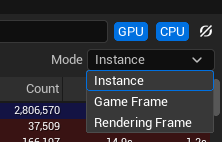
Click the Modes dropdown to select one of the available aggregation modes. Each mode calculates the stats for timers differently and shows different data.
| Mode | Description |
|---|---|
| Instance | Calculate timer stats per timer instance. |
| Game Frame | Calculate timer stats per game frame. |
| Rendering Frame | Calculate timer stats per rendering frame. |
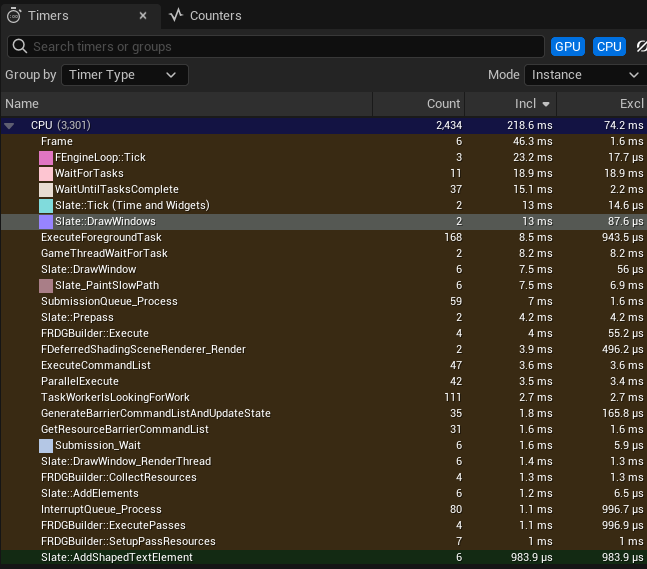
Instance Mode
In Instance mode, the Timers list displays the following data:
| Value | Description |
|---|---|
| Timer or Group Name (Name) | Name of the timer or group. |
| Instance Count (Count) | Number of timing event instances for the selected timer. |
| Inclusive Frame Time (Incl) | Total inclusive duration of selected timer's instances. |
| Exclusive Frame Time (Excl) | Total exclusive duration of selected timer's instances. |
Game/Rendering Frame Mode
In the Game or Rendering frame modes, the Timers list displays inclusive durations for the listed timer events. Inclusive duration is computed for a single frame as the sum of inclusive duration for all instances of the timer in the respective frame. All time values listed are in milliseconds (ms).
| Value | Description |
|---|---|
| Timer or Group Name (Name) | Name of the timer or group. |
| Max Inclusive Time (I.Max) | Calculates the frame's maximum inclusive duration for the selected timer event. The maximum is selected from per-frame inclusive durations. |
| Average Inclusive Time (I.Avg) | Calculates the average per-frame inclusive duration for the selected timer event. |
| Median Inclusive Time (I.Med) | Approximates the median per-frame inclusive duration for the selected timer event. |
| Minimum Inclusive Time (I.Min) | Calculates the frame's minimum inclusive duration for the selected timer event. The maximum is selected from per-frame inclusive durations. |
Changing Sort Order
To change sort order, or to activate or deactivate columns, right-click on the column. The following options are available:
| Sorting Option | Additional Sort Option | Description |
|---|---|---|
| Sort Ascending (by Timer, Group Name, Instance Count, Total exclusive, Total inclusive.) | Sorts Column by Ascending order. | |
| Sort Descending (by Timer, Group Name, Instance Count, Total exclusive, Total inclusive.) | Sorts Column by Descending order. | |
| Sort By: | Timer or Group Name |
Instance Count Total Inclusive Time Total Exclusive Time Sort Ascending Sort Descending | Name of timer or group. Number of select instances. Total inclusive duration of selected timer's instances. Total exclusive duration of selected timer's instances. |
| Column Visibility Group | Description |
|---|---|
| View Column | Hides or shows the following columns. |
Timer Or Group Name Meta Group Name Type Instance Count Total Inclusive Time Max Inclusive Time Average Inclusive Time Median Inclusive Time Min Inclusive Time Total Exclusive Time Max Exclusive Time Acerga Exclusive Time Median Exclusive Time Min Exclusive Time |
| Show All Columns | Resets tree view to show all columns. |
| Reset Columns to Min/Max/Median Preset | Resets columns to Min/Max/Median Preset. |
| Reset Columns to Default | Resets columns to default. |
Asset Load Time
When starting Timing Insights from the command line the Asset Load Time channel can be used to enable named CPU timers for UObject::Serialize and toggle tracing Blueprint names.
To enable asset load time tracking from the command line, you can use the argument
-trace=default,AssetLoadTime
Because there are many timers added when Blueprint names are toggled on, they are hidden in Trace Insights by default.
Enabling Blueprint Names
If you want to enable Blueprint name tracing, you must turn on this argument in the command line.
After enabling Asset Load Time tracking, you can display Blueprint names by adding the argument:
`-statnamedevents`
Executing Commands Without Opening the UI
Timing Insights can be run directly from the command line without opening the UI. You can either specify a single command directly in the command line, or you can execute a series of commands by using a response file. In each case, a set of data is exported to a .csv or .tsv file.
| Command | Description |
|---|---|
TimingInsights.ExportThreads |
Exports a list of GPU and CPU threads. |
TimingInsights.ExporTimers |
This command exports a list of GPU and CPU timers. |
TimingInsights.ExportTimingEvents |
Exports a list of GPU and CPU timing events. The list of events that is exported can be filtered by thread, timer, or by time range. |
TimingInsights.ExportTimerStatistics |
This command exports the list of GPU and CPU timers and their aggregated statistics. Exported files are limited to 100 for a single region and 10000 for the total number of .csv files exported. This command supports the use of ?-type wildcards when specifying regions. |
These commands can be useful for running automated tests.
To specify a response file in the commandline, use the parameter -ExecOnAnalysisCompleteCmd and provide the location to export the response file as a .rsp. For example:
UnrealInsights.exe -OpenTraceFile=path/file.utrace -AutoQuit -NoUI -ExecOnAnalysisCompleteCmd="@=D:\Tests\export.rsp"
Export Functionality
The Timers panel includes the capability to export your timing event data by selecting one or more timers and right-clicking on the context menu.
Timer Options Include:
| Option | Description |
|---|---|
| Highlight Event | Highlights all timing event instances for the selected timer. |
| Plot Timer | |
| Find Instance | Navigates to and selects the event instance with the specified duration. This includes the following options: |
Maximum Duration Instance -- Chooses the event instance with the longest duration. Minimum Duration Instance -- Chooses the event instance with the shortest duration. Maximum Duration Instance in Selection -- As Maximum Duration, but chooses from only the instances in the user's current selection. Minimum Duration Instance in Selection -- As Minimum Duration, but chooses from only the instances in the user's current selection. |
| Open Source in Visual Studio | Opens the source file of the selected message in Visual Studio. |
| Visual Studio must already be open before using this option otherwise it may only open its Start page. |
Other Miscellaneous export options include the following:
| Option | Description |
|---|---|
| Copy To Clipboard (CTRL+C) | Copies the selection of timers and their events to clipboard. |
| Export (CTRL+S) | Exports the selected timers and their grouped statistics to a text file. |
You can navigate to the Timing view and mark the time you are interested in saving from the main timeline view by clicking and dragging on the Time bar. Observe the grouped stats are updated in the Timers panel to reflect the time selection. From the Timers panel, manually select the timers you are interested in saving or use Ctrl+A to select all timers. Next, press CTRL+S or select Export from the context menu and choose a .tsv,.txt or *.csv file to save the selected timers and their aggregated statistics (for selected time range). |
| Export Timing Events | Exports the timing events to a text file. |
Navigate to the Timing view, and mark the time you are interested in exporting from the main timeline view, by clicking and dragging on the Time bar. If no time selection is made, the entire timeline will be exported. In the Timing panel, click on the CPU/GPU thread tracks to show or hide the tracks you want to export. Select the timers you are interested in, or use Ctrl+A to select all timers. Select Export Timing Events (Selection)... from context menu and choose a tab-seperated value (.tsv/.txt) or comma-seperated value (*.csv) file. You can export the "Threads" and "Timers" in order to match the thread id and timer id with the names of threads and timers. |
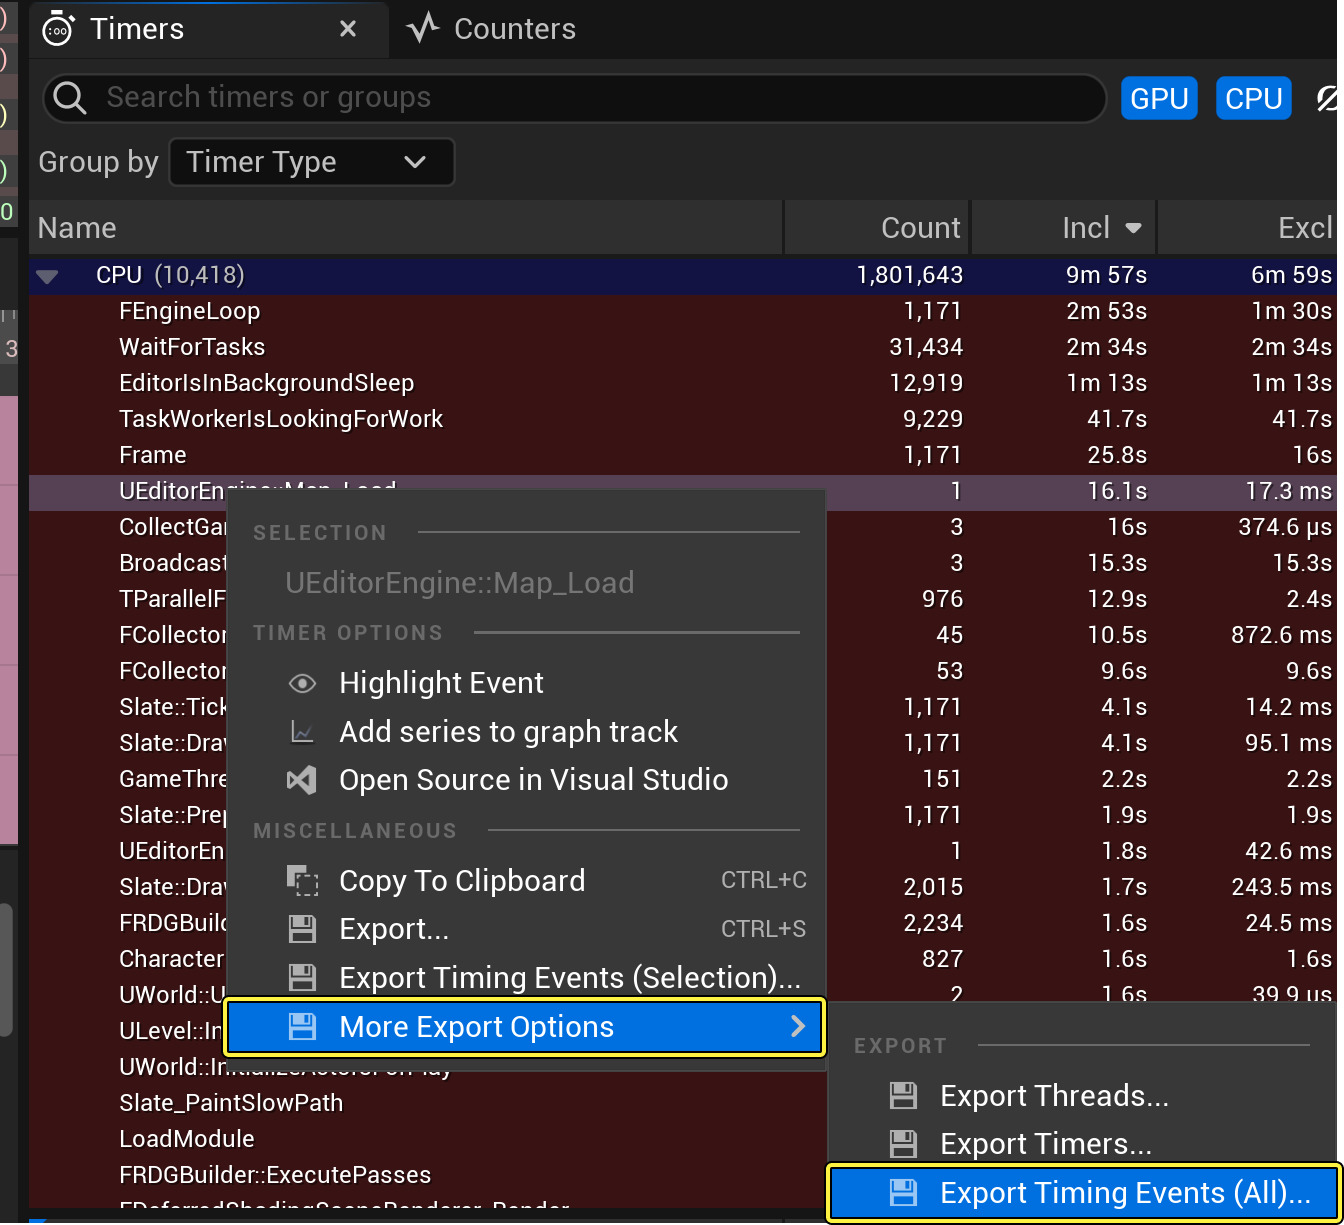
| More Export Options / Export Threads | Exports the list of timers to a text file. (.tsv or .csv). |
| More Export Options / Export Timing Events (All) | Exports all the timing events for all CPU/GPU threads to a text file (.tsv or .csv). |
| The exported file can be massive in size, Even a small session could have several million timing events. |
Source File For CPU Timers
In the Timers panel, the source file and line number is visible in the tooltip of each timer.
Counters
The Counters panel lists all stats incremented during the same time period as the Timers panel. You can rearrange the panel by updating the sort order and column organization.
The following Groups are available:
| Group Name | Description |
|---|---|
| Flat | Creates a single group. Includes all Counters. |
| Stats Name | Creates one group for one letter. |
| Meta Group Name | Creates groups based on metadata group names of counters. |
| Counter Type | Creates one group for each counter type. |
| Data Type | Creates one group for each data type. |
| Count | Creates one group for each logarithmic range.(1-10,10-100, 100-1000) |
Context Menu
The context menu for Counters provides options for copying data and exporting values to tab-separated value (TSV) spreadsheets.
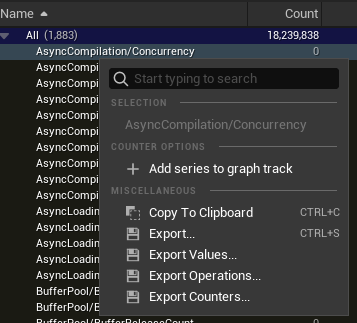
| Option | Description |
|---|---|
| Selection | Displays a summary of the selected counters. |
| Add Series to Graph Track | Adds the selected counters to the Main Graph. |
| Copy to Clipboard | Copies the data from the selected counters to the clipboard in tab-separated format. |
| Export | Exports a tab-separated value (.tsv) file with the data from the selected counters. |
| Export Values | Exports a .tsv file of the selected counters with only the counter values from the selected time region in the Main Graph. |
| Export Operations | Exports a .tsv file of the operations of the selected counters with only the operations from the selected time region in the Main Graph. |
| Export Counters | Exports the full Counters list in a .tsv file. |
1/Frame Counters
Normal counters show all intermediate points within a single frame of activity. 1/frame variants have the ShouldClearEveryFrame flag, and show with the (1/frame) suffix. These only show a single value per each Game thread, specifically the last value in the respective frame. These counters are more useful when investigating variation between multiple frames.
Windows Performance Counters
Windows performance counters appear in the Counters list when you satisfy the following prerequisites:
-
-perfcountersis present on the command-line. -
The counters trace channel is enabled.
These counters display with the prefix PC /.
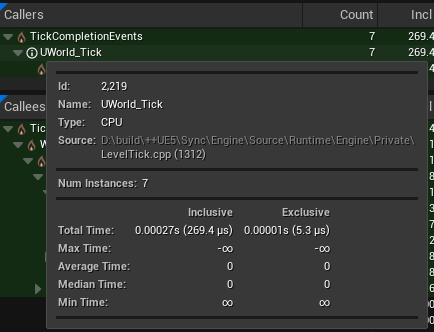
Callers and Callees
The Callers and the Callees panels display a hierarchical list of task events. When you select an event from the Timing view, hovering over the information icon of an individual task will display the following information:
- Id
- Name
- Type
- Source
- Number of instances (Num Instances)
- Detailed information on the Instance count, and total Inclusive and Exclusive time.
- Average Inclusive / Exclusive Time
- Total amount of inclusive/exclusive time divided by the instance count.
- Child Instance Count
- Total number of timing event instances of the child timers (callers or callees).