
Immediate Window
| Command | Description |
|---|---|
{,,UnrealEditor-Core}::PrintScriptCallstack() |
Blueprint callstack |
{,,UnrealEditor-Core}::GFrameNumber |
Current frame number (also works as breakpoint condition) |
{,,UnrealEditor-Core}::GPlayInEditorID |
PIE ID (useful for multiplayer, also works as breakpoint condition) |
UnrealEditor-Engine!GPlayInEditorContextString |
PIE window name (useful for multiplayer) |
Quick Reference
Disabling/Enabling Optimizations
The following macros will disable and enable compiler optimization for the file you add them to:
PRAGMA_DISABLE_OPTIMIZATION
PRAGMA_ENABLE_OPTIMIZATION
When optimization is disabled, code will execute exactly as you wrote it without removing temporary or debugging variables you would need during traces or step-by-step debug sessions. This is useful when you want to selectively debug files without using a full Debug build.
Debug Lines
Debug lines refer to lines drawn in the viewport, usually to show the path of line traces or paths. To use them, you need to include DrawDebugHelpers.h. The following code illustrates how to use DrawDebugLine:
#include "DrawDebugHelpers.h"
DrawDebugLine(GetWorld(), START, END, FColor::Green);
DrawDebugHelpers has numerous debug drawers in addition to standard debug lines. These include:
Primitive Shapes
+ DrawDebugBox
+ DrawDebugSphere
+ DrawDebugCapsule
+ DrawDebugCylinder
+ DrawDebugPlane
+ DrawDebugCone
+ DrawDebugPoint
Solid Shapes
+ DrawDebugSolidBox
+ DrawDebugSolidPlane
Other Common Shapes
+ DrawDebugFrustrum
+ DrawDebugCamera
+ DrawDebugCrosshairs
Meshes
+ DrawDebugMesh
Debug Text
The following code provides an example of how to write debug text to the screen. This mirrors the functionality in the Print String Blueprint node.
#include "Engine/Engine.h"
FString MyDebugString = FString::Printf(TEXT("MyVelocity(%s)"), *MyVelocity.ToCompactString());
GEngine->AddOnScreenDebugMessage(INDEX_NONE, 0.f, FColor::Yellow, MyDebugString, false, FVector2D::UnitVector * 1.2f);
The FString::Printf function can take string format parameters, providing a way to quickly compose strings that include variables. You need to include Engine.h to gain access to GEngine so you can call AddOnScreenDebugMessage. For more information on how to use string formatting, refer to String Handling in Unreal Engine.
Enum to String
Enums can be converted to strings by calling GetNameStringByValue from a static UEnum and providing it with the value you want to get the name of. You must initialize the UEnum with a StaticEnum of the same type as the enum whose value you are passing in.
EMyEnum::Type MyVariable;
static const UEnum* Enum = StaticEnum<EMyEnum::Type>();
Enum->GetNameStringByValue(MyVariable);
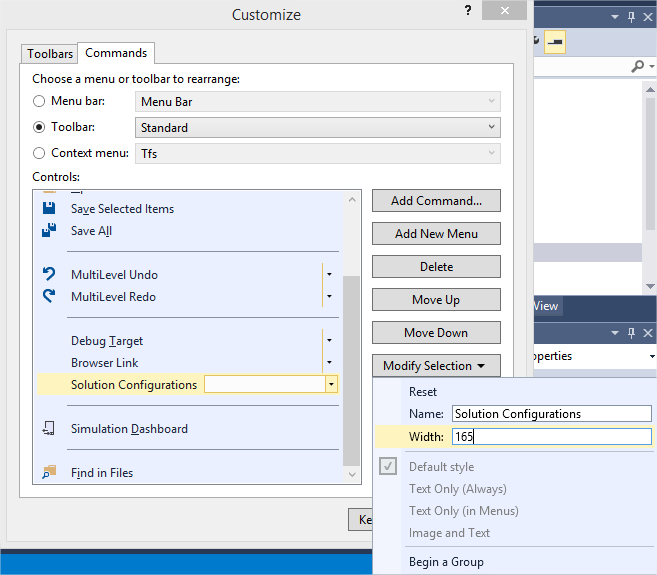
Fixing the Configuration Combobox Width
The default solution configuration combobox is too small to see the full name of the option currently selected. To fix that, right-click on the toolbar, select Customize, select the Commands tab, select the radio Toolbar > Standard, scroll down to the Solution Configurations, click on Modify Selection, and put in the width you would like. A width of 200 is typically useful.
Speeding up Visual Studio 2019
Visual Studio 2019 can be slow when working with Unreal projects. The following are a few strategies that might improve performance for you:
Debugging Is Slow
Try disabling the following settings in Option > Debugging > General:
- Uncheck Enable Diagnostic Tools while debugging.
- Uncheck Show elapsed time PerfTip while debugging.
Perforce Visual Studio history Shows Above Every Method
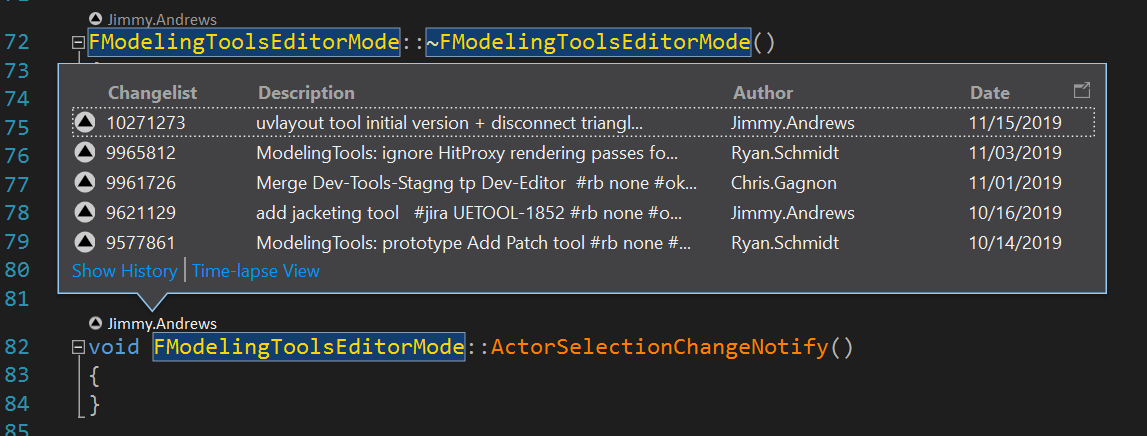
To stop the Perforce Visual Studio history from showing above every method, uncheck Tools > Options > Text Editor\All Languages\CodeLens > Enable CodeLens.
Visual Studio Is Slow when Opening Solutions or Debugging
If you are using another plugin for symbol searching, such as Visual Assist, you can disable the Intellisense database to prevent it from parsing the solution. This can be done from: Tools > Options > Text Editor > C/C++ > Advanced > Set Disable Database = true.