
When you launch Unreal Insights, it opens to the Session Browser window, where you can select which trace session you want to view. This page provides a reference for the Session Browser window, for how to use it to load traces and connect to live trace sessions.
For a full overview of Unreal Insights's workflow, see the Unreal Insights Overview.
Trace Store Tab
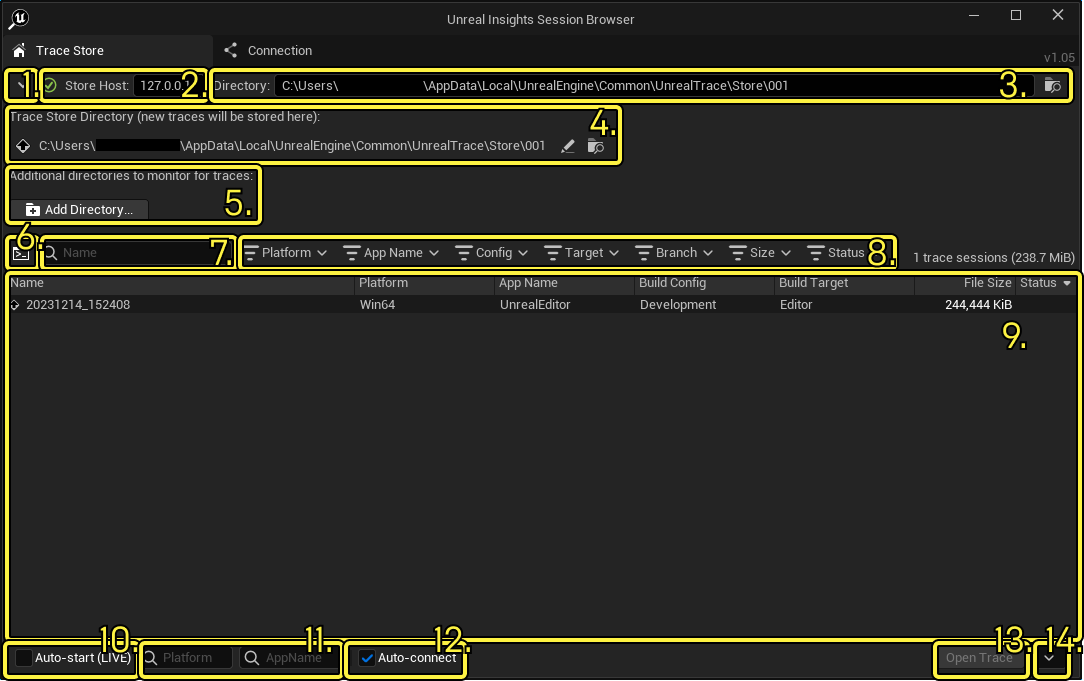
The Trace Store tab provides a list of trace session files available for you to view. This includes files on your local machine as well as files available on a remote trace recorder server. Each session contains recorded data about the performance and resource use of your application.
| Element | Name | Description |
|---|---|---|
| 1 | Manage Store Settings | Click the dropdown to display the trace store directory (4) and additional directories (5). |
| 2 | Store Host | The IP address for your trace server. By default, this is set to 127.0.0.1, meaning it uses the local trace server. If you have a remote trace server, you can provide its IP address to look for trace data there instead. The icon appears as a green checkmark if you connect successfully , or as a warning icon if not. Additional trace server information (version and ports) appears in the tooltip when you highlight this field. |
| 3 | Directory | The directory where the Trace Server stores new traces. |
| 4 | Trace Store Directory | Alternate display of the Trace Store directory (3). This option is normally hidden. Click the foldout to display. |
| 5 | Additional directories | Other directories the Unreal Trace Server monitors for trace files. Trace files from both the Trace Store directory and external monitored directories appear in a unified list in the session list of the Trace Store tab. This option is normally hidden. Click the foldout to display. |
| 6 | Name / Command Line Toggle | Toggles between Name and Command Line filtering when you use the Name filter. |
| 7 | Name filter | Filter trace sessions by name or command line, depending on which mode you toggled (6). Although trace session names are represented with strings of numbers, you can use this filter to narrow down a range of sessions you want to look at. |
| 8 | Filter Bar | Filters for the columns in the trace session list (9). See the Filters section below for details. |
| 9 | Trace session list | A list of the trace sessions available to profile in the directories you selected (3 / 4). You can select multiple trace files at once. |
| 10 | Auto-start analysis toggle | Enables or disables auto-start analysis for live trace sessions. This setting persists between sessions. |
| 11 | AutoStart filters | Restricts auto-start to only occur in specific cases. You can filter for platform or app name. |
| 12 | Auto-Connect (Windows only) | When enabled, UE applications auto-connect with the local trace server and start tracing if Unreal Insights is running. |
| 13 | Open Trace button | Click the Open Trace button to open Unreal Insights for the session you selected in the trace session list (9). |
| 14 | Open Trace Dropdown | The dropdown next to the Open Trace button displays other methods of opening traces. See the section for the Open Trace Dropdown below for more details. |
Filters
The Filters bar contains dropdowns with filters that correspond to the columns in the trace session list. When you click each dropdown, you can toggle values you want to filter for. The types of filters available are as follows:
| Filter | Description |
|---|---|
| Platform | Filter by the target platform of the build you want to profile. For example, Win64, Mac, or Linux. |
| App Name | Filter by the name of the application you want to profile. This is not the same as the trace session name, which is an identifier for individual sessions regardless of what app they belong to. |
| Config | Filter by build configuration. For example, you can filter by Debug, Development, or Shipping-type build configurations. |
| Target | Filter by build target. For example, you can filter by Editor, Game, Client, or Server build targets. |
| Branch | Filter by the branch in your version control system that your application is tied to. |
| Size | Filter based on the size of trace files. |
| Status | Filter based on whether or not sessions are Offline or Live. |
Load a Trace for Analysis
You can use the following options to load a trace for analysis:
- Double-click any trace session displayed in the Unreal Insights browser.
- Select a trace session and click Open Trace.
- If you are using Windows, drag-and-drop a
.utracefile from Explorer over the Unreal Insights window to start analysis of the trace file. - Search for
.utracefiles in other locations by using the Open Trace dropdown.
When you open a trace session, Unreal Insights opens Timing Insights, which provides Insights' main profiling tools.
Open Trace Dropdown
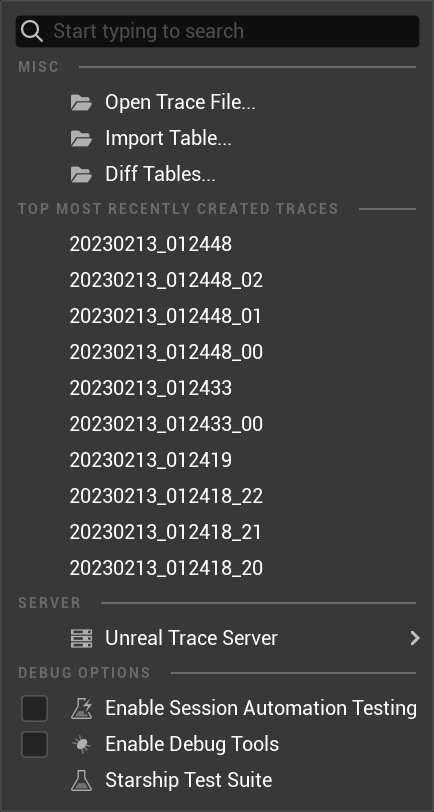
The dropdown next to the Open Trace button displays detailed options for opening traces.
| Option | Description |
|---|---|
| Misc | |
| Open File | Opens a file browser to select a trace file manually. |
| Import Table | Imports a CSV or TSV into a table view. |
| Diff Tables... | Opens two tables in Diff mode. |
| Top Most Recently Created Traces | |
| Trace Entries | Displays the most recently created traces in a list where you can quickly access them. |
| Server | |
| Unreal Trace Server | Displays a sub-menu for the local trace server. See the Unreal Trace Server section below. |
| Debug Options | |
| Enable Session Automation Testing | Activates automatic test system for sessions opened from this window. |
| Enable Debug Tools | Enables debug tools for sessions opened from this window. |
| Starship Test Suite | Opens the Starship UX Test Suite, which contains previews of various UI elements. |
Unreal Trace Server Foldout
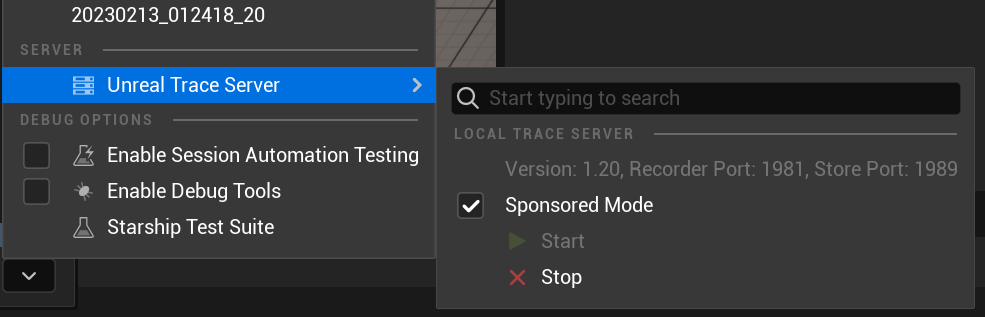
The Unreal Trace Server option in the Open Trace dropdown displays a sub-menu with information and controls for trace server instances. The options available are as follows:
| Option | Description |
|---|---|
| Sponsored Mode | When enabled, the server only runs as long as local processes that use it are still running. |
| Start | Starts the local trace server if it isn't already running. |
| Stop | Stops the local trace server if it is already running. |
In addition to these options, this sub-menu also displays:
- Version number.
- The Recorder Port for the server.
- The Store Port for the server.
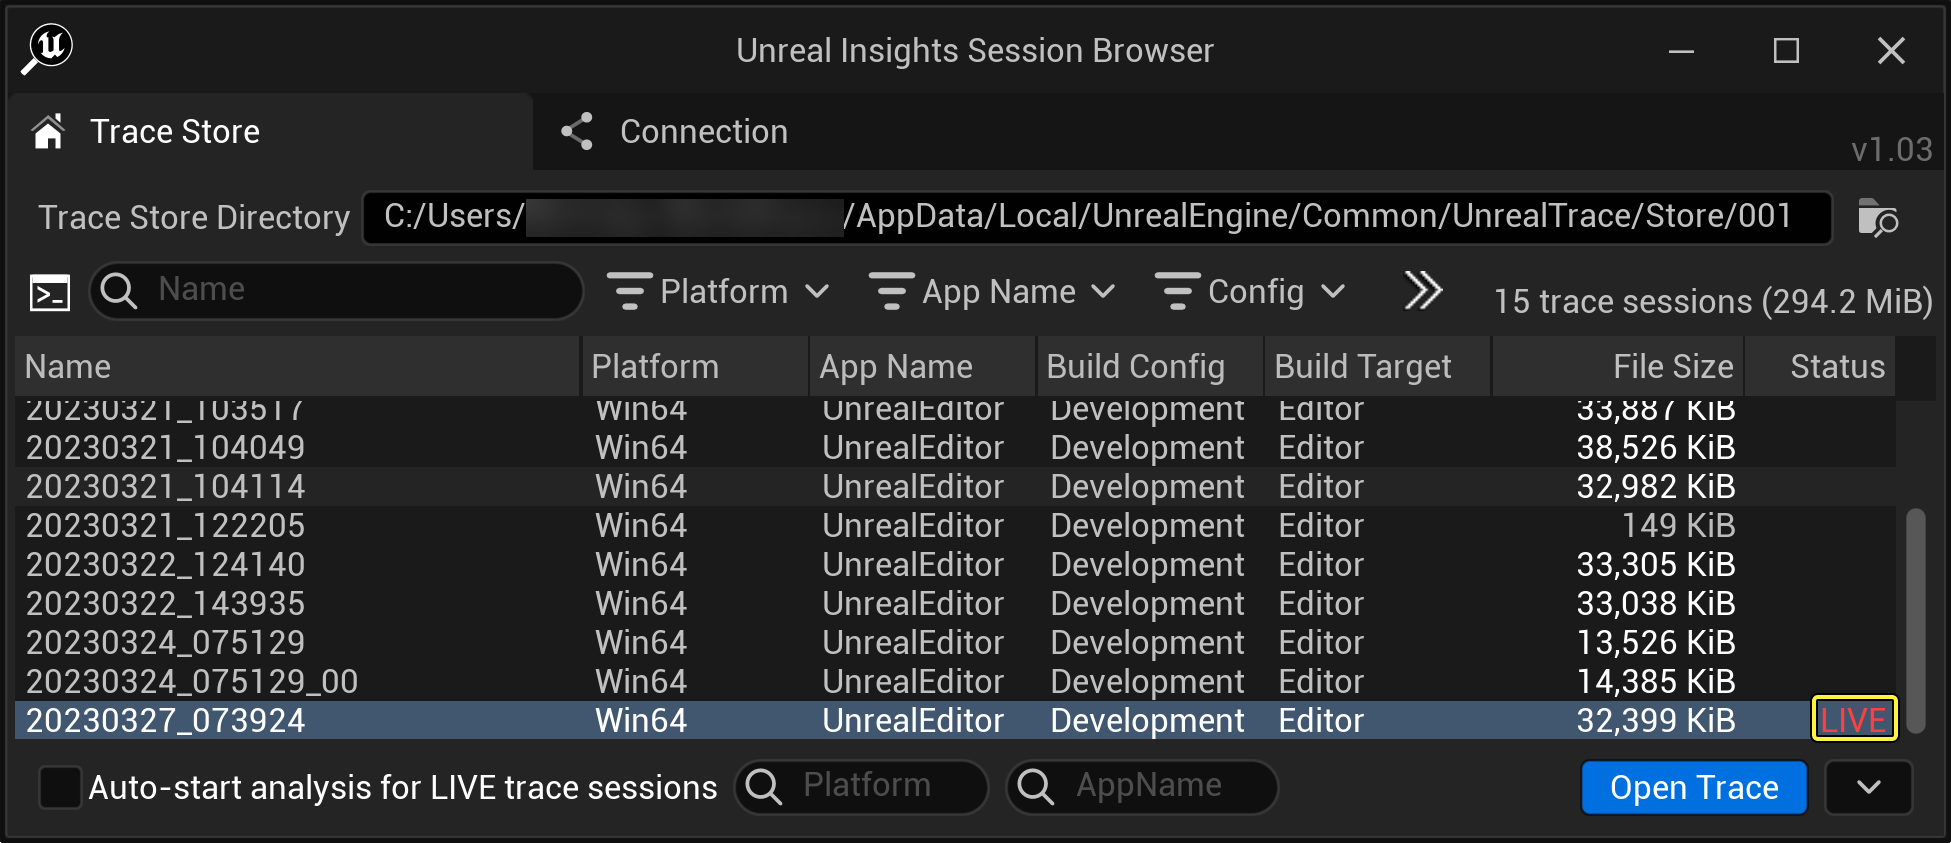
Live Connect
Live status means a trace session is currently recording. If a live trace session connects to Unreal Trace Server, it also appears in the Trace Store list. Live sessions display the word LIVE in the status column and update in real-time while you analyze them. Otherwise, they are identical to pre-recorded sessions.
The tool can monitor multiple sessions at the same time, and it automatically records data for all of them as the data streams in. To analyze these sessions in real-time, load them from the list the same way you load pre-recorded sessions.
Context Menu
When you right-click an entry in the Trace Store list, a context menu displays with actions you can use on that Trace.
| Option | Description |
|---|---|
| Copy Trace ID | Copies the Trace ID of the trace session file to the clipboard. |
| Copy Full Path | Copies the file path where the trace session file is stored. |
| Open Containing Folder | Opens the folder containing the trace session file. |
| Rename | Enters a new name for the trace file. Renaming is disabled when using a remote trace server. |
| Delete | Deletes the selected trace file. If you select multiple traces, you can use this option to delete all of them. Deleting is disabled when using a remote trace server. |
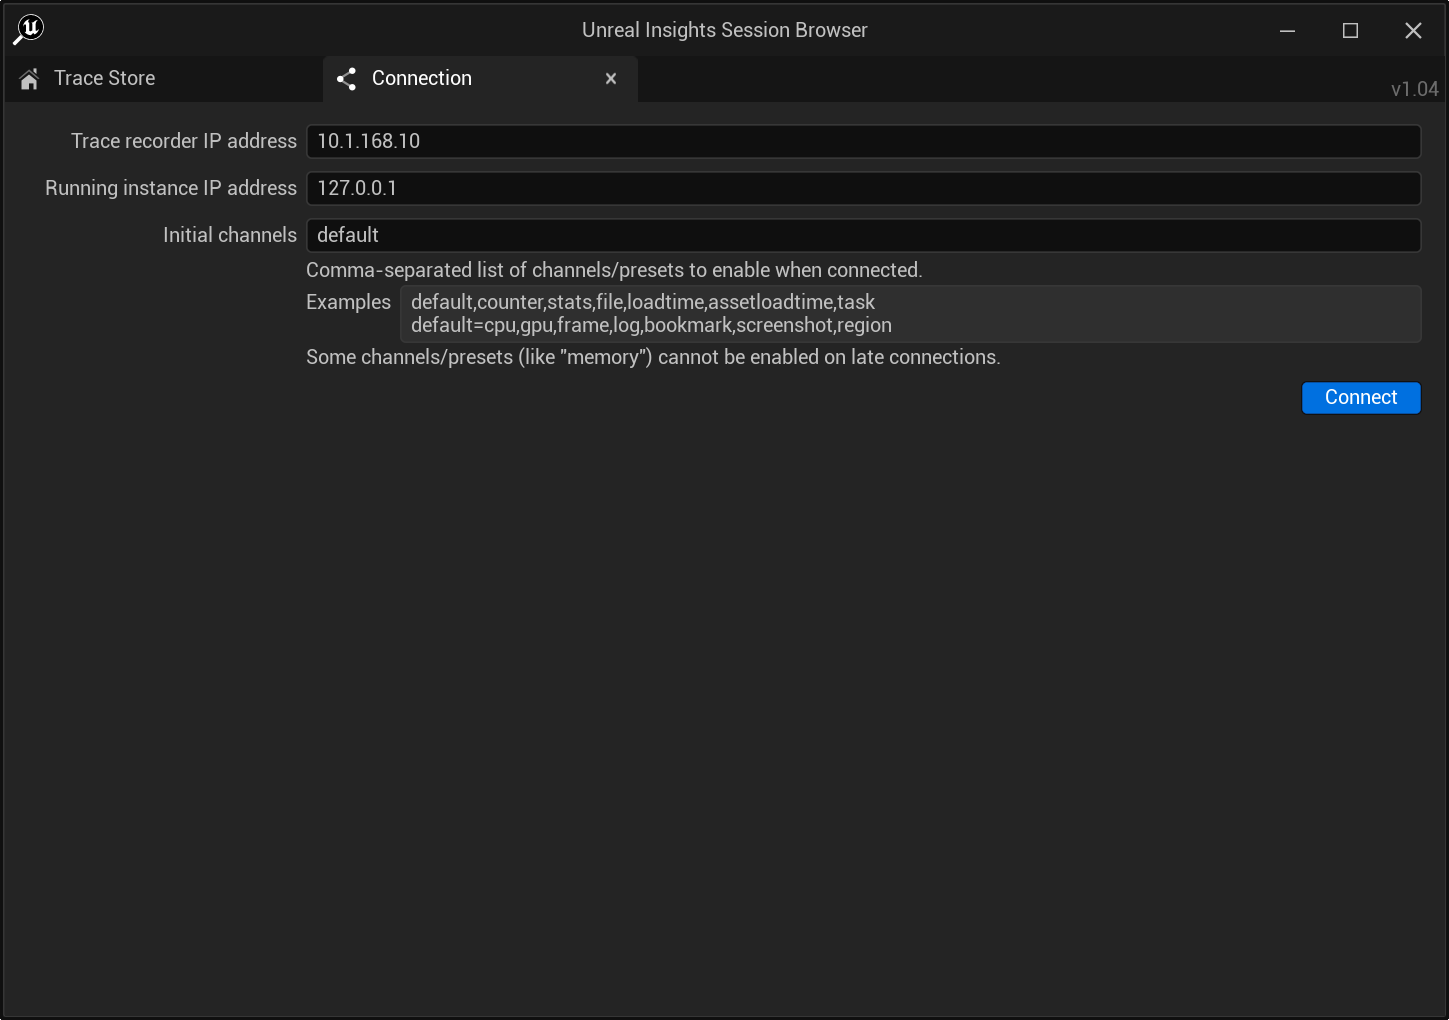
Connection Tab
The Connection Tab provides an interface to connect to a running game or editor using a trace server. It features multiple options to change your connection settings.
| Parameter | Description |
|---|---|
| Trace Recorder IP Address | The IP address of the trace server. |
| Running Instance IP Address Initial Channels | The IP address of the project (running instance) that connects with the trace server to begin tracing data. |
| Initial Channels | A field to specify the list of trace channels to enable when the trace connection begins analyzing data. |
To connect to the trace recorder, fill in each of the above fields and click Connect. A new live session corresponding to the new connection appears in the trace sessions list, marked with the word LIVE. In addition to local trace data, remote trace data is now available in the Trace Store.
Keyboard Shortcuts
| Key | Description |
|---|---|
| Delete | Delete the selected trace session. |
| F2 | Rename the selected trace session. |
| F5 | Refresh the trace session list. |