
Trace is a structured logging framework for tracing instrumentation events from a running process. The modules TraceLog and TraceAnalysis are the principal modules that constitute the framework. The Unreal Trace Server runs in the background as a single server instance and can be shared between multiple projects or branches. It is an optimized program that has minimal impact on performance and does not include a user interface.
The Trace Server launches automatically by a separate server process, UnrealTraceServer.exe, which is located in the Engine/Binaries/Win64 directory folder.
The Trace Server has two components:
- The Trace Recorder listens on port 1981 for incoming trace connections and records the live trace stream.
- The Trace Store stores the recorded traces as files in a folder. It watches this folder for changes and exposes the list of available traces to Unreal Insights UI.
An example of the path to the trace folder is:
C:/Users/<user>/AppData/Local/UnrealEngine/Common/UnrealTrace/Store/001/
Unreal Trace Server
Unreal Editor builds automatically launch the UnrealTraceServer.exe, when you make a connection from the Unreal Trace session browser. The Unreal Trace Server runs in the background as a single server instance and can be shared between multiple projects and branches.
You can shut down Unreal Trace ServerI by accessing your System's Task Manager.
The System Task Manager displays the running Server Trace in the Processes tab.
Unreal Trace Server runs in the background as a single instance that does not need to be terminated in order to launch a new version. It can receive and record data from multiple sources simultaneously.
Currently, we only support one user per machine that is running a Unreal Trace Server. If multiple users are logged in simultaneously, then traces will be stored in the first user's trace directory, therefore leaving them inaccessible to other users.
Trace Insights Widget
The Trace Insights Widget provides a way to control and manage your Trace Data using an Editor interface. You can access the Trace Insights Widget from the bottom toolbar of the Editor.
Trace Data
Trace is capable of recoring large amounts of data. You can choose which type of data to record by using Trace Channels.
Channels
Channels control the data rate when tracing. Each event type is tied to one or more channels. If the required channels are not enabled then the event will not be emitted to the trace stream.
The MemAlloc, MemTag, and Module channels are grey because they must be run from the command the prompt. See From the Command Prompt
Channel presets group channels together to provide scenario-based entry points.
| Channel | Description |
|---|---|
| Animation | Animation Insights Plugin |
| AssetLoadTime | Contains named CPU timers for UObject::Serialize |
| AssetMetadata | Asset Names and Class Names as metadata for memory allocations. Requires Metadata channel. Used by Memalloc channel. |
| Audio | Audio Insights Plugin. |
| AudioMixer | AudioMixer Insights Plugin. |
| Bookmark | Low-frequency markers to signify important transitions. Bookmarks provide a quick overview of features such as level loading or engine boot phases. |
| Callstack | Callstack descriptions. Allows allocations to be associated with callstacks |
| ContextSwitch | Trace context switch events. On Windows, game/editor runtime should be run as administrator. |
| Cook | Displays named CPU timers specific to cooking. This requires the CPU channel to be enabled. Cook will add the both the CookByTheBook and SaveCookedPackage Cpu timing events. |
| Counters | Generic counters. Traces float and integer values over time. Counters Trace API. It enables the CSV Profiler Trace. |
| Cpu | Named Cpu timers. Additional timers can be added by enabling the Stat Named Events channel from the Insights Widget or using the -statnamedevents command line argument. |
| File | File I/O trace channel that contains Open, ReOpen, Read, Write, Close events. |
| Frame | Game and Rendering frames. |
| Gpu | Named Gpu timers. Based on GpuProfiler data. |
| LoadTime | Asset Loading Insights trace channel. Only works for runtime loading from the pak/iostore. [#INCLUDE:testing-and-optimizing-your-content/unreal-insights/trace-in-unreal-engine#LoadTimeChannelSettings] |
| Log | Logs Messages. |
| MemAlloc | Memory allocations. Uses Module and Callstack |
| MemTag | Memory tag statistics. Traces snapshots of memory usage per tag at regular rate. Relies on LLM subsystem for tracing. Implies "-llm". Available after Init(). |
| Messaging | UDP Messaging plugin. |
| Metadata | Support for generic metadata scopes. |
| Module | Module loading information. |
| Net | Networking trace channel. [#INCLUDE:testing-and-optimizing-your-content/unreal-insights/trace-in-unreal-engine#NetworkingCommand] |
| Niagara | Niagara Plugin. |
| Object | GameplayInsights/RewindDebugger plugin. UObject classes, worlds, instances, and events. |
| Physics | Chaos Visual Debugger. |
| RDG | RDG Insights Plugin. |
| RHICommands | Cpu/Gpu named timers for RHI commands. |
| RenderCommands | Cpu/Gpu named timers for commands executed on the rendering thread. |
| SaveTime | Named CPU timers specific to package saving. |
| Screenshot | Captures screenshots triggered with Trace.Screenshot console command or using the TRACE_SCREENSHOT() API. |
| Slate | Slate Insights Plugin. |
| StackSampling | Trace stack sampling events based on Event Tracing for Windows(ETW) |
| Stats | Stats counters. Based on the Stats system. |
| Task | Task Graph trace channel. |
| VisualLogger | Visual Logger starts recording to file. |
You can define your own presets using config files added to the [Trace.ChannelPresets] category. See the Trace Developer Guide for documentation.
In the image above, the Bookmark, Cpu, Frame, Gpu, and Log channels have been enabled. These channels are available by default.
Trace Screenshot
Trace Screenshot takes a picture of your project's viewport during that frame and sends it to the trace. By default, Trace Screenshot is enabled from the channel panel. You can take a Trace Screenshot:
- Click the Insights/Trace widget and click Trace Screenshot (Ctrl+F9)
- Use the console command
trace.screenshot.
When using Trace Screenshot, the Timing Insights timeline displays a vertical line that contains a name generated based on the current timestamp, using the date and time of your screenshot.
Trace Bookmark
Trace Bookmark emits a TRACE_BOOKMARK() event with the given string name. WHen used from the Editor, both the screenshot and bookmark events will generate a name based on the current timestamp using the format of date and time.
Bookmarks and screenshots are visible in the Timing Insights window, and you can find them in the markers track docked on the top toolbar, underneath the ruler track. Bookmarks are available in the Log view.
Stat Named Events
Stat Named Events provide additional profiling metrics that can be enabled or disabled by clicking the checkbox.
Trace Destination
You can choose where to store your trace data by setting the Trace Destination.
Trace Store File
| Destination | Description |
|---|---|
| Trace Store | Sets the Trace Store as the destination. When using this, the server writes the trace data to a file in its managed trace store directory. |
| File | Sets the File as the destination. When using this, the trace data is written directly to the specified file. |
Tracing
Start Stop Trace
| Start Trace | Starts a trace to the selected trace destination. You can start a trace from the Trace Insights widget by clicking the Start Trace button. 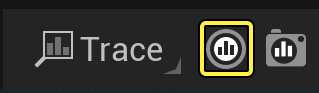 |
| Stop Trace | When a Trace is started, the Start Trace UI icon will be displayed in the color red. You can stop the trace from recording by clicking the Stop Trace button. 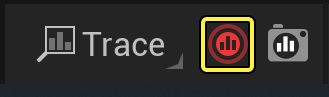 |
Save Trace Snapshot
To save a Trace Snapshot from the Insights Widget, you can:
-
Click the Save Trace Snapshot button.
-
Click the Trace drop-down menu, then navigate to Tracing > Save Trace Snapshot.
Options
| Option | Description |
|---|---|
| Open Live Session on Trace Start | When set to true, the live session will automatically open in Unreal Insights when tracing is started. |
| Open Insights after Trace | When set to true, the session will automatically be opened in Unreal Insights when tracing is stopped or a snapshot is saved. |
| Shown in Explorer after Trace | When set to true, the folder containing the recorded Session will be opened automatically when trace is stopped or when a snapshot is saved. |
Locations
| Option | Description |
|---|---|
| Open Trace Store Directory | The location where traces saved to the Trace Server are stored. |
| Open Profiling Directory | Opens the profiling directory of the current project. This is the location where traces to the file are stored. |
Insights
| Option | Description |
|---|---|
| Unreal Insights(Session Browser) | Launch the Unreal Insights Session Browser. |
| Open Live Session | Opens the current live session. This is only possible when tracing to the store. |
| Recent Traces | Opens the latest traces recorded to the trace store or as a file. |
Trace Status
You can check information about your Connection, Memory Used, Important Events cache, Sent data, Enabled and Available Trace channels by using the command:
Trace.Status
Run Insights From the Command Prompt
-
Navigate to your
Engine\Binaries\Win64folder and double-click UnrealInsights.exe.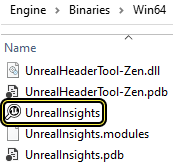
-
Launch the Command Prompt from your operating system and run Your Project.
cd C:\MyEngineInstallLocation\ Samples\Games\Binaries\Win64\YourProject.exe
You may need to change the file directory path to match your local installation path.
Tail Tracing
Tail Tracing tracks events over the last few seconds (depending on the buffer size), therefore any machines that may be able to display a lead-up.
The default size of the buffer is 4MB, however if you wish to modify or deactivate it, you can do so by entering the following command using the Command line:
-tracetailmb=X
Setting X to 0 MB will deactivate it, other values will change the buffer size accordingly.
Late Connect
Important events are cached on the Unreal Engine client side, then sent to late-connecting machines during connection, therefore one-time events(Important Events) won't be missed before you can make a connection.
Insights can instruct remote running Unreal Engine instances to connect to the remote trace servers from its local UI instance without needing to involve the local machine.
Late connect can be initiated by navigating to Unreal Insights > Connect, or from the Editor cmd console by typing any of the following commands:
"trace.send [ip]" / "trace.start [filename]"
-trace.start [file] [channelSet] -tracehost=[ip]
-tracefile = [filepath]
Unreal Insights has a file-based caching system that makes it possible for the application to attach additional information to a trace. This can be used to retrieve previously calculated results faster, or store data that would otherwise be lost such as symbols. The cache is stored in a .ucache file next to the trace file.
Trace User Guide
You can use different workflows to run traces in Unreal Insights. See the Trace User Guide for documentation.
Trace Developer Guide
You can develop your own traces in Unreal Insights. See the Trace Developer Guide for documentation.