Enabling CPU Task Trace
Follow the steps below to profile a CPU Task:
-
Enable the Task and CPU trace channels when running your application from the command line by using the following command:
-trace=default,task -
Navigate to the Unreal Insights Session Browser. and open your .trace file in Unreal Insights by selecting a trace from the Trace Store directory. If a session has Task events, the following functionality is available in the Timing Insights view.
a) When hovering over a Timing Event, if the current event is inside a task, extra information is displayed in the tooltip.
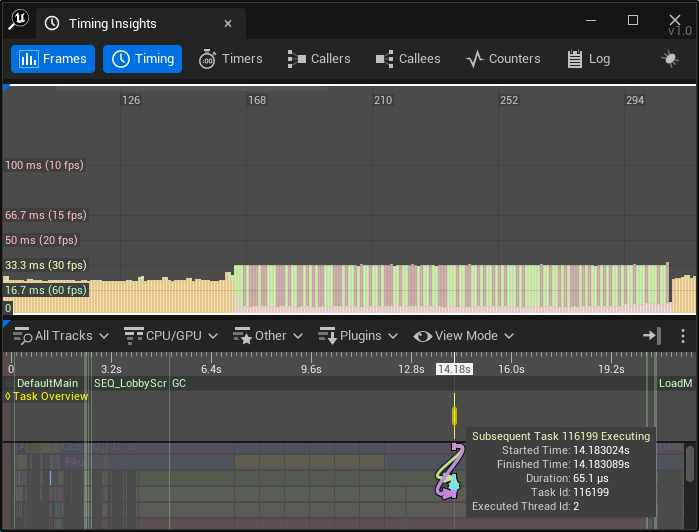
b) Navigate to the Other > Tasks submenu from the Timing View track. You can use this to display task graph related visualizations.
| Tasks Submenu Option | Description |
|---|---|
| Show Task Critical Path | Show or Hide relations representing the critical task containing the current path. |
| Show Task Transitions | Show or hide transitions between the stages of the current task. |
| Show Task Connections | Show or hide task connections between the following options:
|
| Show Transitions of Prerequisites | Show or hide stage transitions for the current task's prerequisites. |
| Show Transitions of Subsequents | Show or hide stage transitions for the current task's subsequents. |
| Show Tansitions of Parent Tasks | Show or hide transitions for the current task's parent Tasks |
| Show Transitions of Nested Tasks | Show or hide stage transitions for the current task's nested tasks. |
| Show Task Overview Track | Show or hide the Task Overview Track when a task is selected. |
| Show Detailed Info on the Task Overview Track | Shows the current task's prerequisites/nested tasks/ subsequent in the Task Overview Track. |
c) Right-click anywhere in the Timing View panel to open the timing view context menu. This menu is used to display new options that can be used to sort tracks on the Task graph.
| Menu Option | Description |
|---|---|
| Top Docked | Docks this track to the top. |
| Scrollable | Moves this track to the list of scrollable tracks. |
| Bottom Docked | Docks this track to the bottom. |
d) When you navigate to Tasks, the Show Task Dependencies menu options display in the drop-down menu, when a timing event is selected, and if there is a task that encompasses the selected timing event.
The following data is displayed:
- Relations in the form of arrows are drawn on the timing view to show the lifetime and stages of the task. This includes information on when it was created, launched, scheduled, started, finished and completed.
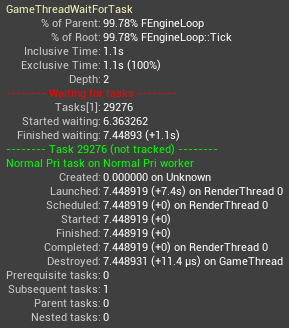
- Relations are drawn between the current task and its prerequisite, subsequent, and nested tasks.
- A new top docked track appears showing the stages of the task as timing events.
Task Dependencies
When activating one or more of these options, all of the relations mentioned in the previous section are drawn for the prerequisite, subsequent, and nested tasks of the current task.
As an example, instead of a single relation from the prerequisite task's Completed Time to the current task's Scheduled Time, you now see the relations depicting the created, launched, scheduled, started, finished and completed stages of each prerequisite task enabled:
When analyzing your data, we recommend trying to activate each option one at a time as the number of relations can quickly become overwhelming.
-
When the Critical Path option is enabled, relations showing the critical path of the current task are drawn. The critical path is defined as the execution chain in the current task's graph that has the longest execution time. Each component task's execution time is defined as the difference between the component's FinishedTime and StartTime (FinishedTime - StartTime).
This Engine feature is new, therefore the formula is subject to change with optimizations in the future.
-
If a trace has Task data, then the Tasks minor tab becomes visible. To populate the tab, select an interval on the timing view. The tab updates to show all the tasks in the selected interval. The tab shows each of the included timestamp options: created, launched, scheduled, started, finished, and completed timestamps. By default, these timestamps are shown Relative to previous, which means they are relative to the previous stage, for instance scheduled is relative to launched. Double-clicking on a task in the table draws its relations as if it was selected by selecting a timing event in the timing view.