
Introduction
Horde implements a telemetry collector which can receive and process events sent by the Unreal Editor.
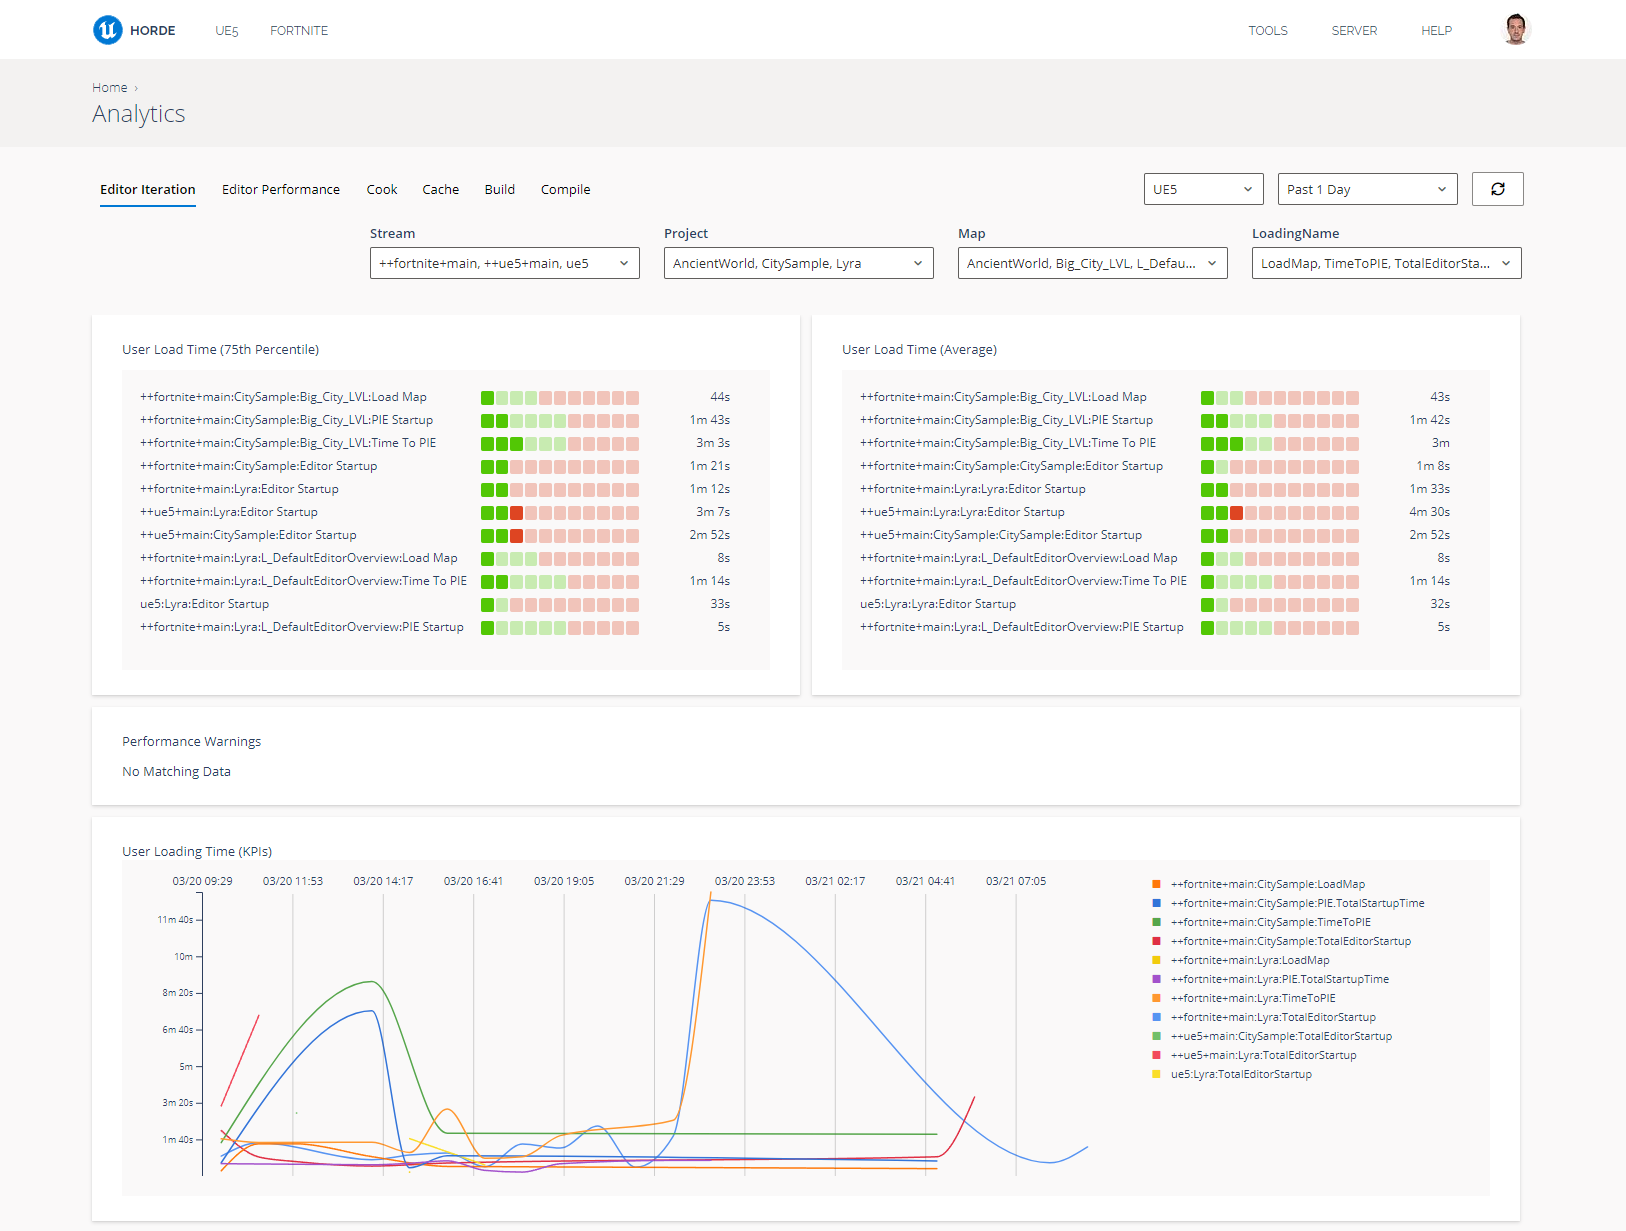
Horde aggregates telemetry events into metrics for discrete time intervals, which can then be charted by the Horde dashboard to give valuable insights into the bottlenecks experienced by your team.
Prerequisites
- Horde Server installation (see Getting Started: Install Horde).
- An Unreal Engine project targetting Unreal Engine 5.5 or later.
Steps
- Open your project in the Unreal Editor and go to the
Edit > Pluginsmenu. Search for theStudio Telemetryplugin and make sure it is enabled. It should be enabled by default. -
Open your project's
DefaultEngine.inifile (in theConfigfolder next to your.uprojectfile) and add the following lines:[StudioTelemetry.Provider.HordeAnalytics] Name=HordeAnalytics ProviderModule=AnalyticsET UsageType=EditorAndClient APIKeyET=HordeAnalytics.Dev APIServerET="http://localhost:13340/" APIEndpointET="api/v1/telemetry/engine"Make sure to replace the value for
APIServerETwith the address of your Horde Server. -
Configure a telemetry store to aggregate metrics from your telemetry events. There are some default metrics and charts included with the Horde installation, which can be added by adding the following snippet to your globals.json file:
// Define the 'Engine' telemetry store and create some standard metrics within it. "telemetryStores": [ { "id": "engine", "include": [ { "path": "$(HordeDir)/Defaults/default-metrics.telemetry.json" } ] } ], // Configure a default dashboard to render them "dashboard": { "include": [ { "path": "$(HordeDir)/Defaults/default-analytics.dashboard.json" } ] },