
Animation Insights is a Plugin for Unreal Engine that you can use to profile and observe your project's gameplay and animation systems' performance in real time, using visually rendered trace data. By recording trace information during PIE (Play in Editor) simulation, you can monitor your project's performance bottlenecks, in relation to frame rate targets, in order to find optimization opportunities.
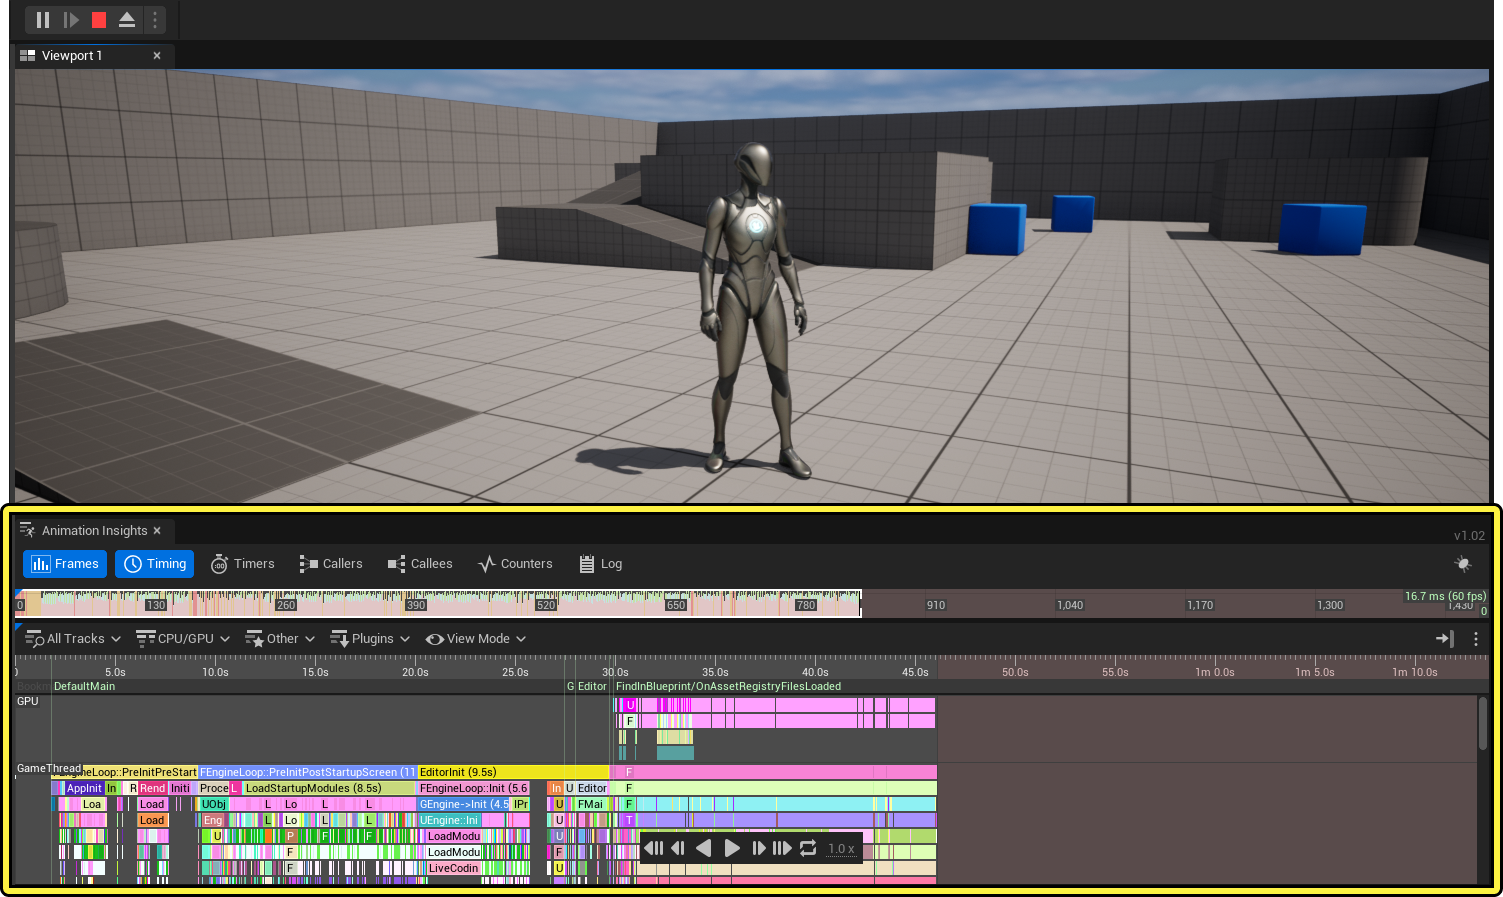
The Animation Insights plugin contains a performance graph that you can use to observe gameplay and animation system performance, in addition to animation states and live behavior updates, such as variable and blend values over time. By tracing your project's data, Animation Insights will track changes in data values, and plot that information into color coded tracks, which you can use to debug and optimize your project.
You can enable trace recording, to observe changes in your project's data, for the following data types:
- Animation Poses, Curves, Blend Weights, Montages, Anim Notifies as well as a schematic Anim Graph view with a live update that replaces the
showdebug animationsystem.
Using Trace Data Filtering you can select the specific trace data types written out to the recorded data set. You can also select the individual gameplay objects that output trace data using Source Filtering.
Prerequisites
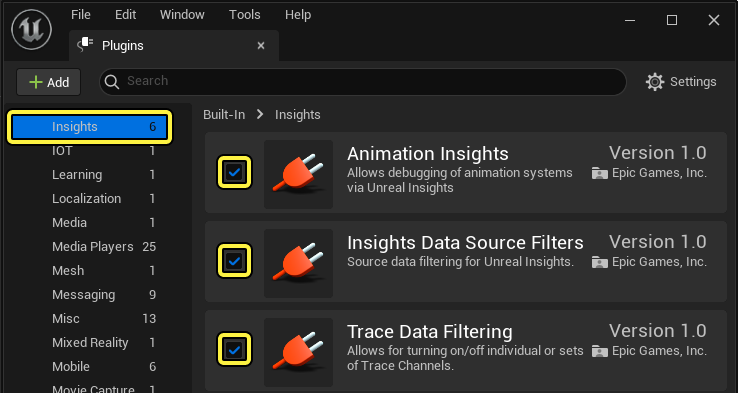
- Enable the following Plugins. Navigate in the Menu Bar to Edit > Plugins and locate the Animation Insights, Insights Data Source Filters, and Trace Data Filtering plugins, listed under the Insights section, or by using the Search Bar. Enable the Plugin and restart the editor.
Using Animation Insights
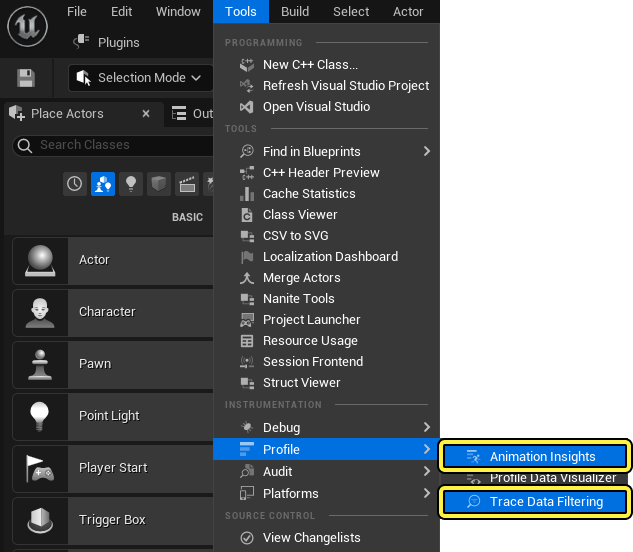
After installing the plugins, open the Animation Insights and Trace Data Filtering panels. Navigate in the Menu Bar to Tools > Profile and select both the Animation Insights and Trace Data Filtering options.
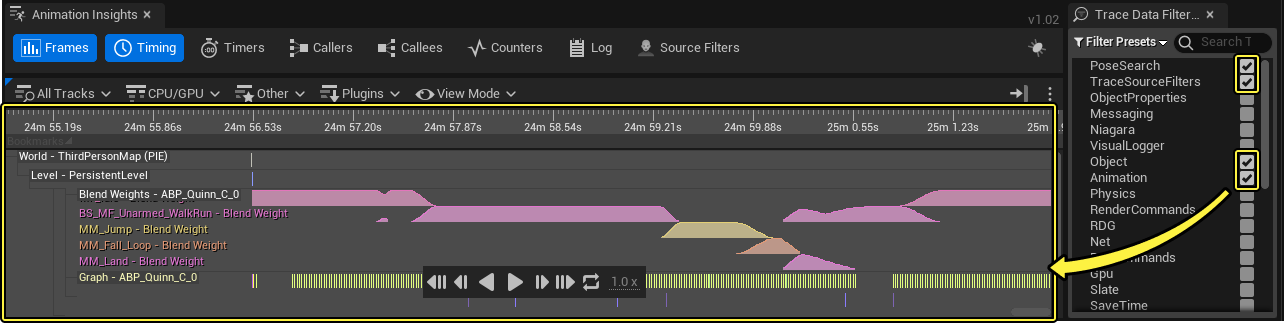
You can enable Trace Channel Filters in the Trace Data Filtering panel, which will then populate the Animation Insights panel's graph with corresponding data in realtime.
Animation Insights stores this data in .utrace files in your computer's application data, you can access these trace files using the Unreal Insights Application, which you can launch alongside your editor by navigating in the Menu Bar to Tools > Launch Unreal Insights.
It is important to ensure animation traces are not left enabled beyond your debugging or optimization needs as the .utrace files can become very large.
Trace Data Filtering
After opening the Trace Data Filtering panel, you can toggle Trace Channel states individually to record or ignore select data types in real time. These selections are then tracked and recorded in the Animation Insights panel during and outside of PIE and rendered as a graph that you can use to observe changes in data over time.
It is important to be selective about the amount of channels you enable, and how long they are left enabled. Selective channel filtering will limit the amount of performance overhead for your project, and the size of the stored .utrace files to save your computer's disk space.
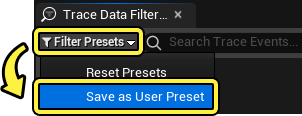
After making Trace Channel selections, you can save the combination of selection as a Filter Preset, by selecting the Filter Preset drop down menu, and selecting Save User Preset.
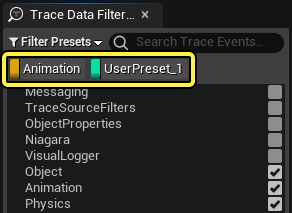
After enabling a Preset, you can quickly toggle enabled presets using the Preset Buttons in the Trace Channel list's header.
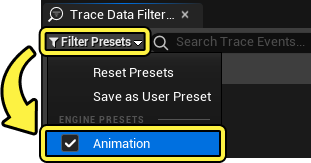
By default there is a pre-set Animation filter that enables the most relevant Trace Channels for tracking animation data in your project. The Animation preset filter includes Object, Animation and Frame tracking. You can enable the Animation preset filter by selecting the Filter Preset drop down menu, and selecting Animation.
For more information about tracing data types for debugging and optimization workflows, see the Unreal Insights documentation.
Trace Source Filtering
You can use Trace Source filtering to toggle the gameplay objects that can output trace data. This can be especially helpful when debugging or profiling a large-scale project, with a large number of Actors and Components in a given Level at once. With Trace Source filtering you can select which actors and components you want to record trace data, organize the output information, limiting the performance overhead, and reducing the amount of logged data to save your computer's disk space.
To open the Trace Source Filter window, select the Source Filter button in the Animation Insight panel's toolbar.
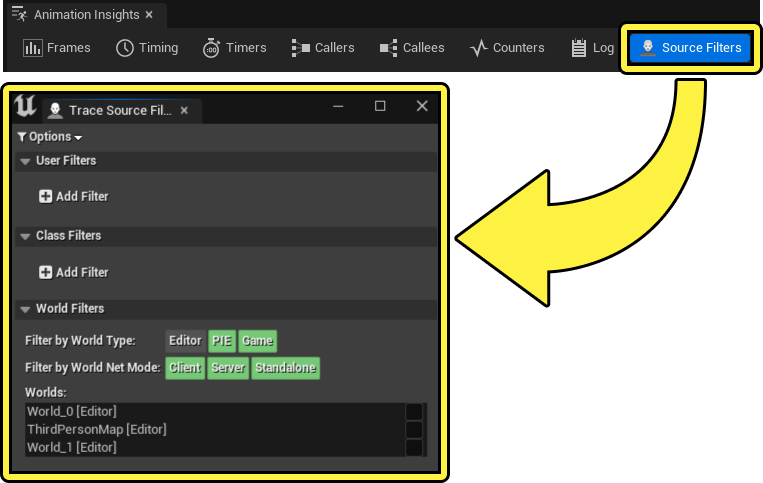
Class Filters
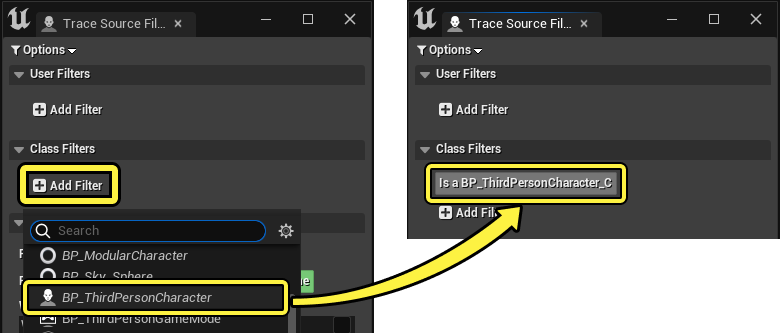
In the Class Filters section of the Trace Source Filtering panel, you can create filters based on your project's Blueprint Classes, to limit trace recording to only the enabled filter selection. To create a new Class Filter, select (+) Add Filter in the Class Filters section. Then select the blueprint or game object you want to record trace data from. The filter will now appear in the Class Filters section.
After creating a filter, you can optionally enable the filter to record trace data for all other game objects that are derived from the original game object or blueprint, by left-clicking the filter and selecting Include derived classes.
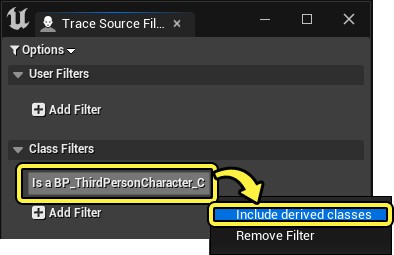
You can also select Remove Filter to delete the filter.
User Filters
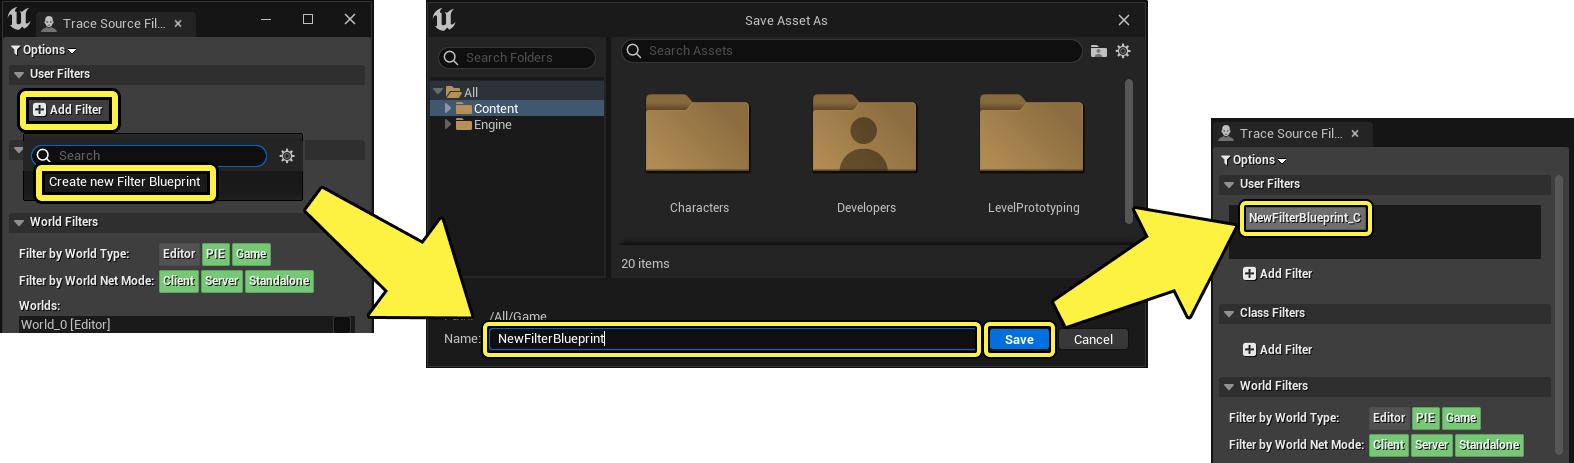
You can also create your own custom filter blueprints to record trace data. In the User Filters section, select (+) Add Filter, and navigate in your project's file structure to the location you wish to save the blueprint. Assign the new blueprint a name and select Save. A new blueprint will be created that you can use to build custom trace collection logic.
After creating a custom source filter blueprint, in the Trace Source Filters panel's User Filters section, you can right-click the filter to bring up a context menu to define how the filter is used to record trace data.
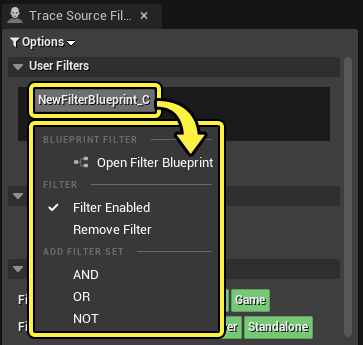
Here you can reference a list of the context menu option and a description of their functionality:
| Option | Description |
|---|---|
| Open Filter Blueprint | Opens the custom filter blueprint in the Blueprint Editor. |
| Filter Enabled | Toggle the filter's functionality when filtering recorded trace data from your project. |
| Remove Filter | Delete the currently selected custom source filter from the Trace Source Filter panel. |
| AND | Set the custom filter to operate in addition to any other User Filters. |
| OR | Set the custom filter to operate instead of other present User Filters. |
| NOT | Set the filter to exclude trace recording for objects tracked using the custom filter. |
World Filters
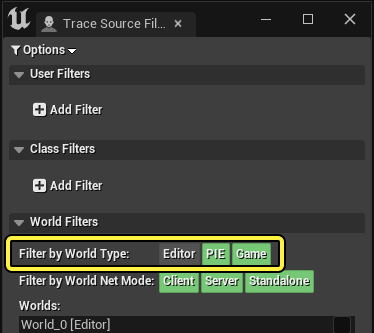
You can set the context of trace recording on the different levels of your project using the World Filter section. You can toggle trace recording to occur during your project's PIE (Play in Editor) simulation, during actual game operation, and within the context of the editor. You can toggle the trace reccroding with each of these contexts using the buttons adjacent to the Filter By World Type property.
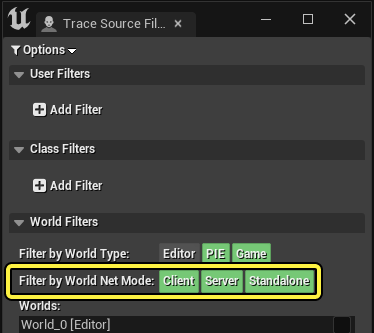
You can also control the trace recording that occurs during network operations for multiplayer and network based projects. Using the Filter by World Net Mode property, you can enable trace recording for the filtered sources, by Client, Server, and Standalone renders of the project.
For more information about Trace Recording World Filters in Unreal Engine, see the Channel Filtering documentation.
Using Animation Insights
Animation Insights expands on the pre-existing showdebug animation feature, which displays internal animation runtime data. The ability to visualize and analyze the information enables users to locate and identify potential sources of animation irregularities or improper performance behaviors.
The default, showdebug animation feature can be limiting, because the showdebug animation system only outputs text logs to the screen. With Animation Insights, users can record the frame ranges containing undesirable animation system behavior while being able to play back the recorded section of animation or gameplay while reviewing the logged data.
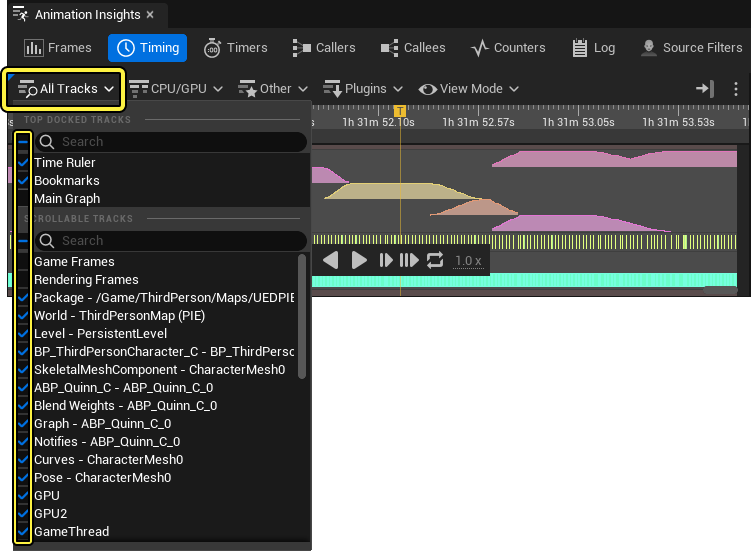
After enabling an array of Trace Source Filters, you can run your project to record the animation data changes over time. The data is organized into Tracks which are layered horizontally in the Animation Insights panel's timeline. Each track displays a unique set of data, and only are present when the corresponding Trace Source Filters are enabled.
You can toggle each track's visibility using the All Tracks button in the Animation Insights toolbar menu.
Track Inspection
You can view the data in each track over time visually using the Animation Insights graph. Tracks can also display numerical data by inspecting the track. Each track contains different data, so each track's inspection is contextual to the data type the track is monitoring. You can expand the data contained within a track by right-clicking the track title on the left side of each track, and selecting the expansion options available in the context menu.
When selecting an expansion option, such as View Properties or View this Graph, an auxiliary panel will open that contains the tracks data, at the point in time the Animation Insights timeline's playhead is occupying.
Track Types
Each Animation Insights data track contains relevant and contextual data for the data type it contains, as well as relevant data expansion options and properties.
Here you can reference a list of common Animation Insights tracks and a description of the data they contain:
| Track Name | Description |
|---|---|
| Notifies | Notifies Tracks display the presence and state of Animation Notifies and Sync Markers contained in the traced character's animations. The topmost lane of the track displays the per-frame events, such as animation ticks, notify events such as audio queues and effects, as well as sync markers. Other lanes display the active notify states. You can right-click the track and select View Properties to display the notifies that are active on the current frame. |
| Curves | Curves Tracks display all animation curves that were active in the current frame. You can right-click the track and select View Properties to see an expanded log of the curve values that were active at the selected frame. |
| Pose | Pose Tracks show or hide active Actor poses at the selected frame. You can right-click the track to enable a debug drawing of the poses or skeleton during the selected frame. |
| Graph | Graph Tracks show when the traced graph updates, indicated with vertical bars at the corresponding time intervals. You can right-click the track and select Debug this Graph to open the Animation Blueprint debugger panel and connect it to the track. With the Animation Blueprint debugger open, you can scrub the timeline to view the graph's data update in corresponding point in time. The Animation Blueprint Debugger panel includes pose link weight, state machine state, asset player position and blendspace sample data. Select View this graph to see a schematic tree view of the animation graph. |
| Montage | Montage Tracks show animation Montage asset information over time, including blend weights as well as section states and transition data. |
| Blend Weights | Blend Weights Tracks show all the assets that were active in a frame and their effective blend weights. You can right-click in the track to go to the node in the Animation Blueprint that the graph corresponds to at the selected frame. You can also view other track data such as playback time or blendspace coordinates. |
Animation Insights Control Reference
Here you can reference a list of hotkeys and shortcuts you can use when working within the Animation Insights panel to observe animation debug data.
| Input Shortcut | Function |
|---|---|
| Ctrl + Left Mouse Button | Scrubs the Time Ruler in the graph header, to control the current time, allowing values to be evaluated in schematic views, poses to animate in the viewport, and more over time. |
| G | Toggles the Graph's visibility. |
| V | Auto-hides all tracks that have no timing events in the current Viewport. |
| I | Togglesthe I/O (File Input) Overview and Activity Track's visibility. |
| L | Toggles the Asset Loading Track's visibility. |
| Y | Toggles the GPU Track's visibility. |
| U | Toggles the CPU Thread (and all CPU thread group) Track's visibility. |
| R | Toggles the Frame Track's visibility. |