Timing Insights is the main window used for profiling UE trace sessions. It displays per-frame performance data and provides tools for inspecting individual processes, including separate tracks for the CPU and GPU. Using Timing Insights, you can:
-
Determine which frames are experiencing spikes in required processing time.
-
Inspect the timeline for those frames to see which timing and counter events are taking the most time.
-
See a detailed breakdown of what events are processing on which threads and cores.
-
Highlight timer and counter events to see how many instances of them are running.
-
View the hierarchy of callers and callees for an event.
-
Isolate events and plot them on a graph alongside your timeline for a clear visualization of processing spikes.
-
Trace the execution path of Tasks.
-
View CPU context switches.
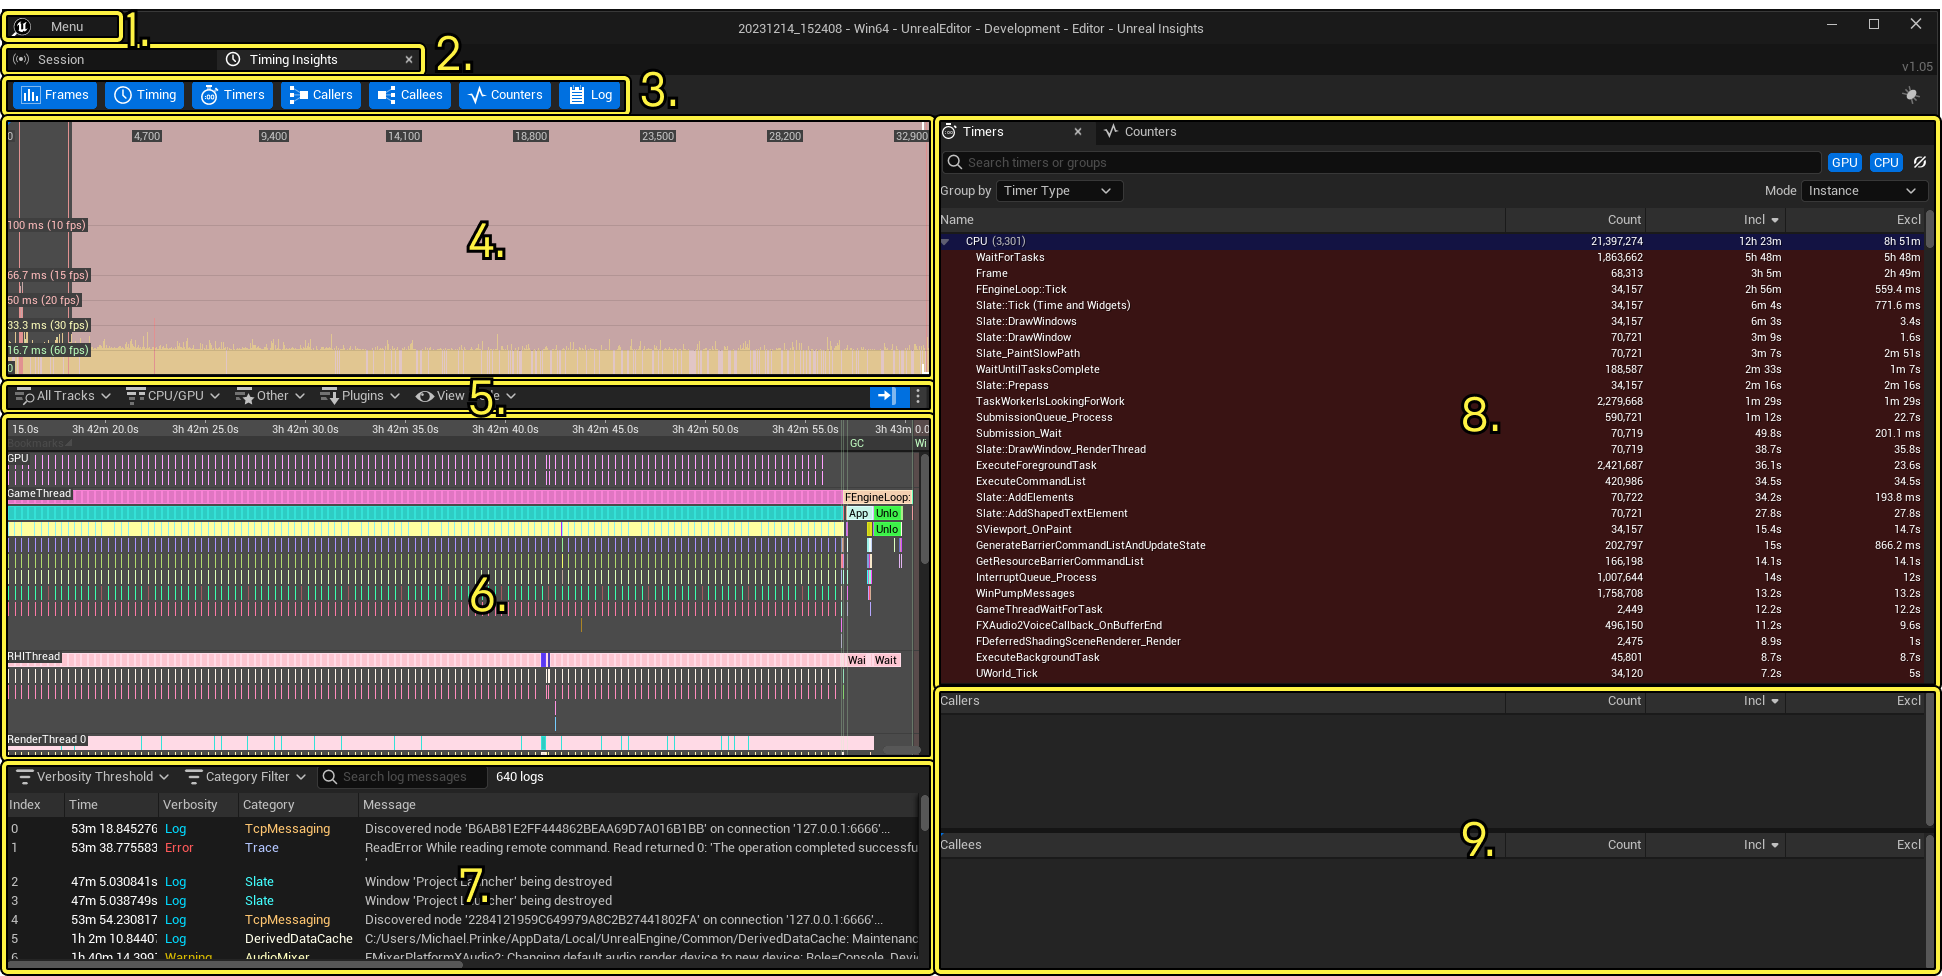
The Timing Insights window features the following elements:
| Index | Name | Description |
|---|---|---|
| 1 | Main Menu | Drop-down menu providing options for configuring the Timing Insights window and accessing other menus. |
| 2 | Session and Timing Insights Tabs | Switch between your session info (if using a live session) and the Timing Insights window. |
| 3 | Main Toolbar | Toggles visibility of other menu panels. |
| 4 | Frames Panel | A timeline showing frame-by-frame resource usage data. |
| 5 | Timing Panel Toolbar | A toolbar that filters tracks in the Timing Panel. |
| 6 | Timing Panel | A panel that shows detailed information about resource usage separated into different tracks. Tracks include general CPU/GPU as well as individual threads. |
| 7 | Log | A list of log outputs created during the trace session. Click a log entry to highlight its position in the Timing Panel. |
| 8 | Timers and Counters | Displays a list of processes in the highlighted portions of the Frames/Timing panels as well as information about how much time each process takes to execute. |
| 9 | Callers and Callees | When you select a function in the Counters or Timers panels, these display what functions are calling it (Callers) and what functions it calls (Callees) during the current highlighted frame. |
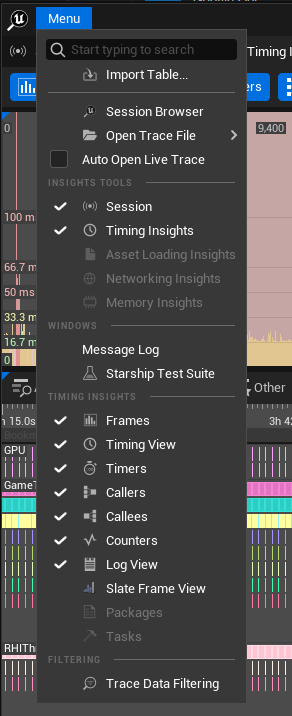
Main Menu
Click the Menu button in the upper-left corner to open Timing Insights' dropdown menu, which provides options for configuring the Timing Insights window and manipulating files.
| Index | Name | Description |
|---|---|---|
| 1 | File Management | Options for opening trace files, including manually importing tables. |
| 2 | Insights Tools | A list of currently active Insights windows/tabs. |
| 3 | Windows | Additional windows for debugging the Timing Insights tool. |
| 4 | Timing Insights | A list of panels in the Timing Insights window. Click to toggle them on and off. |
| 5 | Filtering | Options for filtering during live sessions. |
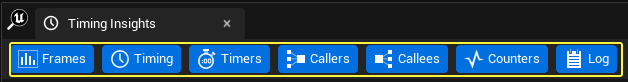
Main Toolbar
The toolbar provides the capability to select blocks of time to view in groups, sort or categorize data, and review log output.
You can toggle the visibility to display data for that frame in the Timing, Timers, Callers, Callees, Counters, and Log tracks by clicking on each respective track.
You can select blocks of time to view in aggregate, show or hide the respective panels. sort or categorize data, and review log output. To do this, click on a single frame in the Frames panel, or click and drag a section of the scrub bar at the top of the Timing panel, known as the Time Ruler.
Frames Panel
The Frames panel displays the total time taken by each frame using a bar graph format. This is useful for identifying general trends, such as low performance or framerate drops when a level is loaded, an unoptimized scene is visible, or spawning a large number of Actors simultaneously.

For more information, see the Frames Panel page.
Timing Panel
The Timing panel shows a detailed view of CPU/GPU usage organized into separate tracks for each thread. Each track represents a processing thread and displays a timeline of events. The width of each event indicates how much time the thread spent processing it.
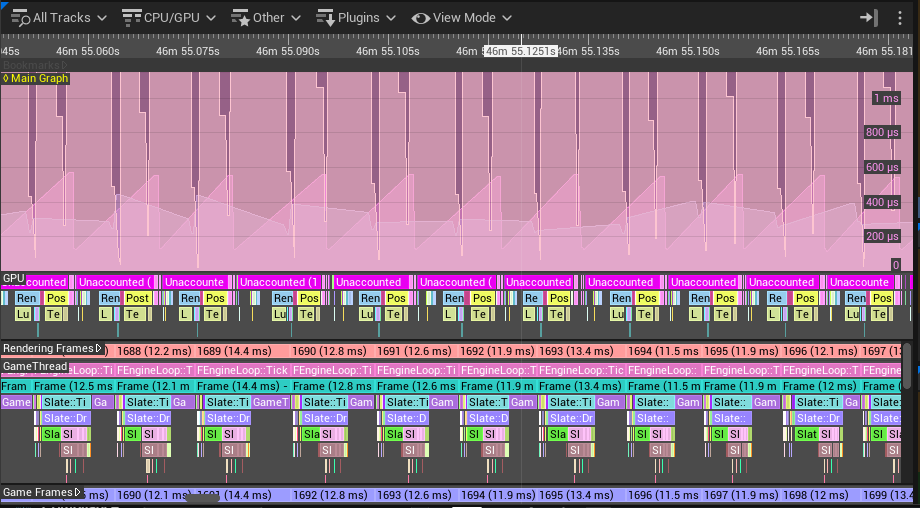
For more information, see the Timing Panel page.
Timers and Counters
The Timers panel lists all timer events that run within the time range designated in the Timing panel (see above). In addition to grouped data based on time range, the list can be sorted in ascending or descending order by the values in any active column.
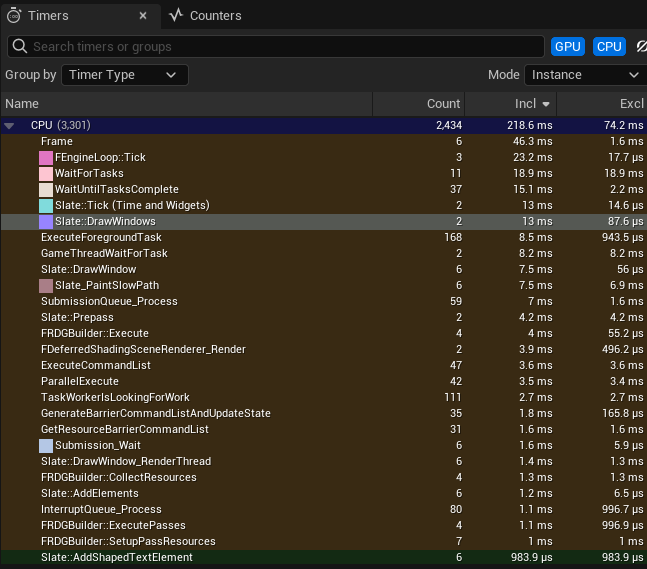
Alternatively, you can view a list of events in the Counters panel, which lists all stats incremented during the same time period as the Timers panel.
For more information, see the Timers and Counters page.
Callers and Callees
When you select an event in the Timers or Counters panels, the Callers and Callees panels populate with a list of related functions.
-
The Callers panel shows a list of all the functions that call the selected event.
-
The Callees panel shows a list of all the functions that the selected event calls.
For more information, see the Callers and Callees section of the Timers and Counters page.
Log
The Log view displays all logs generated by calls to the macro UE_LOG from the Trace session. The logs can be filtered by verbosity and category, similar to the Output Log window in the Editor. For more information, see the Timing Insights Log page.
Quick Find Panel
The Quick Find widget is used to search and filter events displayed in the Timing view. The widget can be opened from the Timing view context menu by right-clicking on a Timing event or by using the CTRL + F shortcut when the Timing view has focus. You can then build a series of filters to find the events you're looking for.

For more information, see the Quick Find Panel page.
Special Trace Channels
Some workflows in Timing Insights are not enabled by default. To use them, you need to run your application or the editor with specific trace channels active in your command line parameters. You can add these channels in the -trace= parameter. For example, the following command would run MyGame.exe with the default, Context Switch, and Task channels active:
Command Line
`MyGame.exe -trace=default,ContextSwitch,Task -tracehost=127.0.0.1`
Make sure to run your command line with administrator privileges to ensure that these trace channels take effect.
When you open a trace session with these channels active, additional display options will be available to examine their relevant information.
| Workflow | Trace Channel Name | Description |
|---|---|---|
| Context Switches | ContextSwitch |
Provides additional display options for CPU and GPU Core tracks, including options for displaying CPU context switches. See Context Switches for more information. |
| Tasks | Task |
Records and views data for Tasks. Timing Insights provides options for tracing the execution path of Tasks, including their prerequisite tasks and subsequent tasks, when this channel is active. See Task Graph Insights for more information. |