
The Visual Logger is a powerful debugging tool that creates and records visual representations of the gameplay state, and provides the ability to review this data in the Editor. Developers can see debug output live during a play session, or review it in the Editor after the session is over, making it much easier to resolve gameplay bugs that are hard to track down based only on user reports or game footage. The ability to record information for later review is especially important when working with rare or difficult-to-reproduce bugs. For example, an unexpected AI behavior may be caused by a game state variable that changes for a single frame can be studied after the fact by recording the data and scrubbing through the frames around the moment when the bug happened.
To activate the Visual Logger, use the menu in Windows > Developer Tools > Visual Logger. In Unreal Engine versions prior to 4.7, enter the console command "VisLog". If you are in the Editor, the Visual Logger viewport will also open.

Using the Visual Logger during a session of the Epic Games sample, StrategyGame. The purple line indicates the AI's path, and the red location marker shows the selected point in the timeline.
The Visual Logger Viewport
In the Editor, the Visual Logger viewport provides the ability to review Visual Logger output from pre-recorded sessions, enabling developers to review a bug after the fact.
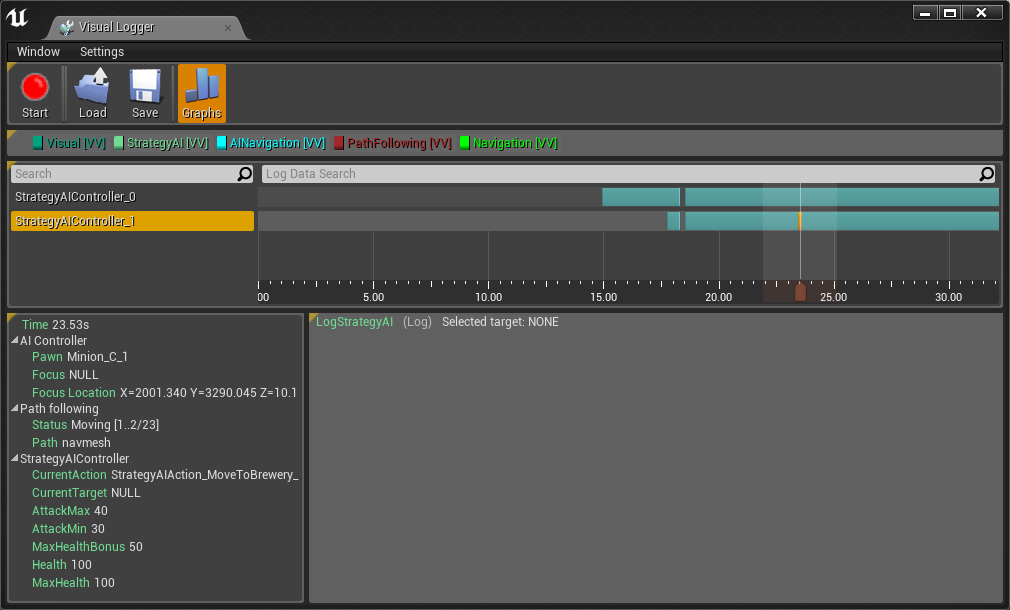
The Visual Logger viewport in the Editor.
The viewport contains a list of all Actors that logged any visualization data, a detailed snapshot of the status of the Actor selected in the Actor list, a text window for displaying debug message output, and a time bar to enable scrubbing through the recorded data.
The Actor List
The highlighted area in the following image shows the list of Actors that have logged information to the Visual Logger during the recorded session. There is also a search bar to help users find a specific Actor's log information quickly.

The Actor list and its search bar.
The Actor Snapshot View
Any data that an Actor collects with the UE_VLOG macro will appear in the highlighted area of the following image. The Visual Logger will display data coming from the Actor selected in the Actor list, at the time indicated by the timeline scrubber. Data that the Visual Logger captures as part of the snapshot can be categorized and customized in your game's code, and you can expand or collapse these categories.
Making multiple visual logging calls in the same frame and from the same Actor will overwrite the previously-captured data.

The Actor snapshot area with custom categories expanded.
The Text Window
The Visual Logger's text window shows log messages from the current frame, broken up into categories. Multiple log messages recorded in the same category and the same frame will show up as a list.

The text window area where debug messages appear.
The Timeline
The timeline view features a bar that advances (or rewinds) the logger to any point in time you choose. In the image below, the scrubber is at the 23.53 second mark, and the Actor list has "StrategyAIController_1" selected. By scrubbing the time bar, you can view the selected Actor's status and the text window at different times in the recorded log data.

The timeline area.
Adding Visual Logger Support
There are three types of data that you can add to the Visual Logger:
| Data Type | Output Description |
|---|---|
| Actor Snapshots | These will appear in the Actor snapshot area, and should update once per frame while the actor exists. |
| Log Messages | All text that you log with the Visual Logger will appear in the text window. Text appears on a single-frame basis. |
| Debug Shapes | You can draw a variety of shapes into the game world. These shapes can last for multiple frames, and have many adjustable parameters, such as size and color. |
Taking Actor Snapshots
To add data to the Actor Shapshot View, you must first implement the IVisualLoggerDebugSnapshotInterface interface function as follows:
class MYPROJECT_API AMyActor : public AActor, public IVisualLoggerDebugSnapshotInterface
This interface contains only one function, GrabDebugSnapshot, which does nothing by default. You can override this function to feed information to the Visual Logger. Because GrabDebugSnapshot should only run in builds with Visual Logging enabled, it is a good practice to check the ENABLE_VISUAL_LOG macro around any code related to it. For example, the function declaration in your Actor class would include a block of code that looks like this:
#if ENABLE_VISUAL_LOG
//~ Begin IVisualLoggerDebugSnapshotInterface interface
// Adds information about this Actor to the Visual Logger.
virtual void GrabDebugSnapshot(FVisualLogEntry* Snapshot) const override;
//~ End IVisualLoggerDebugSnapshotInterface interface
#endif
The following sample code was part of a GDC demo that added Visual Logging to a customized version of the First-Person Shooter template's Character class called AGDCCharacter. This code adds a single entry under the "GDC Sample" category. The entry is labeled "Projectile Class" and contains the type of projectile that the Character spawns when firing.
#if ENABLE_VISUAL_LOG
void AGDCCharacter::GrabDebugSnapshot(FVisualLogEntry* Snapshot) const
{
Super::GrabDebugSnapshot(Snapshot);
const int32 CatIndex = Snapshot->Status.AddZeroed();
FVisualLogStatusCategory& PlaceableCategory = Snapshot->Status[CatIndex];
PlaceableCategory.Category = TEXT("GDC Sample");
PlaceableCategory.Add(TEXT("Projectile Class"), ProjectileClass != nullptr ? ProjectileClass->GetName() : TEXT("None"));
}
#endif
This function will run automatically on the first call to the Visual Logger. Add any information that you want to see in the Actor Snapshot View into this function.

Visual Logger with the Actor Snapshot of an AGDCCharacter.
Logging Text
You can log to the Text Window with the UE_VLOG macro. The Text Window displays information on a per-frame bases, so only text logged in the current frame will show up as you scrub through the recorded data. You can log text from anywhere, and the UE_VLOG macro will cleanly remove itself from compilation in builds that don't support the Visual Logging system, so it is safe to use without checking the ENABLE_VISUAL_LOG macro. The macro takes parameters indicating the Actor associated with the text, the log category and verbosity level (used for filtering the display), and the text itself.
In the following sample code, our customized Character uses UE_VLOG to log information after firing a projectile:
void AGDCCharacter::OnFire()
{
// Try to fire a projectile
if (ProjectileClass != NULL)
{
// Collect our aim rotation.
const FRotator SpawnRotation = GetControlRotation();
// MuzzleOffset is in camera space, so transform it to world space before offsetting from the character location to find the final muzzle position.
const FVector SpawnLocation = GetActorLocation() + SpawnRotation.RotateVector(GunOffset);
UWorld const World = GetWorld();
if (World != NULL)
{
// Spawn the projectile into the world at the muzzle's location.
World->SpawnActor

Visual Logger showing debug text from our AGDCCharacter.
If you want to send a duplicate message to the standard log, you can use the UE_VLOG_UELOG macro instead of calling UE_VLOG followed by UE_LOG with the same data.
Drawing Debug Shapes
The ability to log shape information in the game world is a powerful feature because it helps you visualize what is going on. The following image shows some of the different types of shapes that the Visual Logger supports.

Path information, cylinder, cone, capsule, and box shapes.
The following macros provide support for logging shapes. Each macro requires an Actor that owns the shape, a log category and verbosity level, several additional, shape-defining parameters (depending on the shape), and the text that will accompany the shape. The following table provides information about the available shapes and the additional parameters each shape requires.
| Shape | Description | Additional Parameters |
|---|---|---|
UE_VLOG_SEGMENT |
A one-pixel-thick line segment. |
|
UE_VLOG_SEGMENT_THICK |
A line segment with variable thickness. |
|
UE_VLOG_LOCATION |
A sphere. |
|
UE_VLOG_BOX |
An axis-aligned box. |
|
UE_VLOG_OBOX |
A rotated box. |
|
UE_VLOG_CONE |
A cone. |
|
UE_VLOG_CYLINDER |
A cylinder. |
|
UE_VLOG_CAPSULE |
A capsule. |
|
UE_VLOG_MESH |
A 3D Mesh. |
|
UE_VLOG_CONVEXPOLY |
A 2D convex-hull polygon. |
|
UE_VLOG_ARROW |
A line segment with an arrowhead. |
|