
What a GPU Crash Looks Like
When working in graphics-heavy projects, it is possible that you may encounter a GPU crash. When this happens, you will see a window like the following.
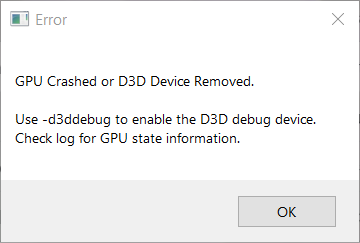
It is often followed by a Unreal Engine Crash Reporter window.
Click image for full size.
Why a GPU Crash Happens
Windows has implemented a safeguard to prevent applications from locking up by using too much memory, when processes take too long to complete, and various other reasons. In these situations, Windows will kill the GPU driver, resulting in an application crash.
When you get a GPU crash, the callstack and logs may have messaging such as "GPUCrash - exiting due to D3D device being lost - D3D Hung" and "DXGI_ERROR_DEVICE_REMOVED with Reason: DXGI_ERROR_DEVICE_HUNG."
GPU crashes can occur for various reasons, such as:
- Running out of memory (OOM)
- Times out while doing an expensive operation (TDR event)
- A bug in the engine code
- A bug in the driver
- A bug in the Operating System
- A problem in the hardware
For these reasons, in an application like Unreal Engine, it is not possible to always know why a crash occurs and may be impossible to avoid a crash at the application level. The sections below provide you with some debugging options to help identify the root cause and some preventative measures you can take.
Debugging GPU Crashes
When a crash occurs in Unreal Engine, you may want to start by looking at the callstack generated by Crash Reporter and log files that contain information to help in understanding what is happening. However, when a GPU crash happens, the CPU callstack does not really point to the real cause of the crash but just indicates what the CPU was doing when the GPU crash happened. Therefore, it provides no actionable information.
There are two debugging command line arguments that you can use to output logs with useful information.
-gpucrashdebuggingcollects GPU progress and tracks the current GPU state when debugging GPU crashes.-d3ddebugprovides information about the D3D pipeline.
We strongly recommend not using these command line arguments together. You should run the engine with each of the flags separately to generate logs.
After running the engine with each of these command lines and getting the crash, the logs are saved in [Your Project]/Saved/Logs folder.
When an application crashes in Windows, it generates dump files that can also be helpful in diagnosing a crash. You can learn more about these on Microsoft's Visual Studio documentation for using Dump files in the Visual Studio debugger.
Resolving GPU Out-Of-Memory (OOM) Issues
If the GPU runs out of memory, it could potentially cause a crash. It largely depends on the RHI being used, some are more resilient than others and in the case of an OOM event, they may get slow instead of dying.
To understand why an out of memory crash may be occuring, start with the Windows Task Manager and use the Performance tab. Here, you can select your GPU (1) and see its availble memory and how much it is currently consuming (2).
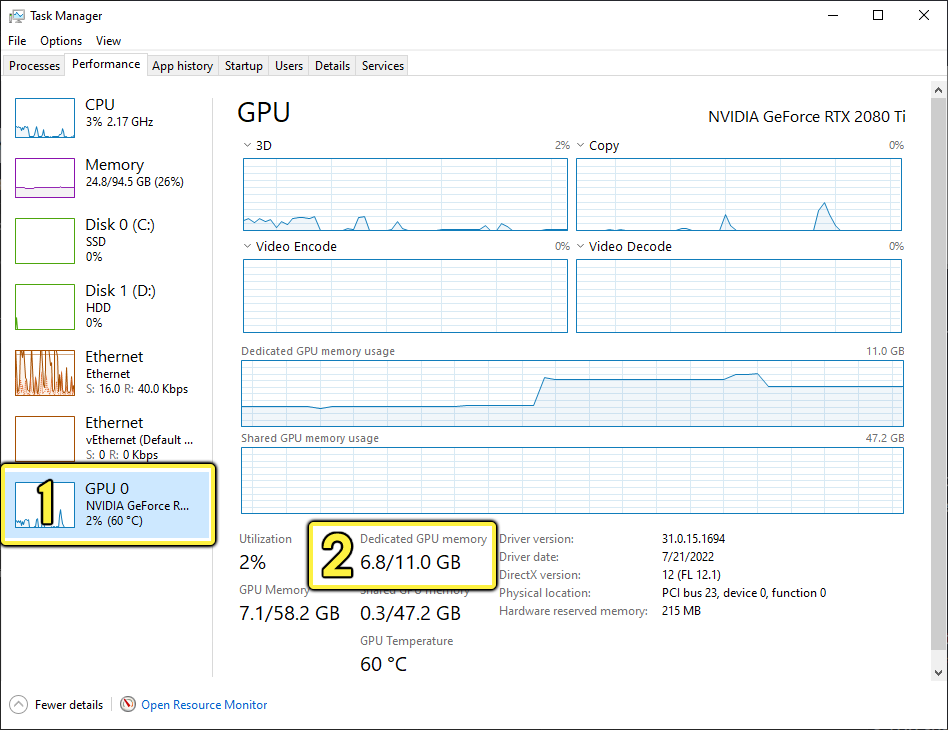
Windows Tasks Manager displaying the current stats for the GPU that include its available memory and current amount consumed.
With your project open and running, you can see how much GPU memory is being consumed versus what is availble. If you are close to the available memory limit, it is most likely the problem causing the crash. In this case try the following:
- Close other programs that may be consuming large amounts of GPU memory.
- Simplify the scene using lower resolution textures, lower resolution meshes, culling to reduce objects in the scene, and so on.
- Use a lower screen resolution.
- While working in the editor, you can use the Level Viewport Screen Percentage to render at a lower resolution.
- While working in the editor, if you have multiple viewports open, close all but one.
- Avoid disabling primary features like Niagara or Ray Tracing.
- Bypassing these components changes many things, which could lead to invalid conclusions as to the cause of the GPU crash.
Understanding GPU Time Outs Caused by Expensive Operations (TDR Event)
When the CPU sends a command to the GPU for computing something, the CPU sets a timer to count how much time the GPU needs to complete the operation. If the CPU detects the operation is taking too much time (by default, it is two seconds in Windows), it resets the driver causing a GPU crash to occur. This is called a TDR event (or Timeout Detection and Recovery).
Ideally, the engine should never send the GPU such an amount of work that triggers a TDR event. Instead, the engine should be able to split the task into smaller chunks so that TDR is avoided. In order to avoid these types of events, you can increase the amount of time it takes for a timeout to occur by editing the Windows Registry (see steps below for How to Resolve TDR Events).
TDR Events with Ray Tracing
Hardware Ray Tracing is particularly costly and is more likely to trigger TDR events when it is enabled. Some expensive ray tracing passes (such as Ray Tracing Global Illumination at very large resolutions) could take a long time to render and could trigger a TDR event.
The most expensive ray tracing passes (global illumination, and reflections) provide a way to render the passes in tiles instead of a single pass using the following console variables:
r.RayTracing.GlobalIllumination.RenderTileSizer.RayTracing.Reflections.RenderTileSize
When the tile size of a pass is greater than 0, these passes are rendered N x N pixel tiles, where each tile is submitted as a separate GPU command buffer. This allows high quality rendering without triggering timeout detection.
How to Resolve TDR Events
One way of avoiding TDR events is to increase the amount of time it takes for Windows to trigger one by editing the Windows registry keys. In this guide, you are going to create two new registry keys: TdrDelay and TdrDiDelay.
-
TdrDelaysets a timeout threshold. It is the number of seconds the GPU delays the preempt request from the GPU scheduler that handles processing and memory (VRAM). -
TdrDdiDelaysets the amount of time the operating system (OS) allows threads to leave the driver. After that time has elapsed, a timeout delay failure occurs.
To learn more about registry keys, consult Microsoft's documentation about Tdr Registry Keys.
Changing the registry keys on your Windows operating system can have unexpected consequences and require a full reinstallation of Windows. Although adding or editing the registry keys in this tutorial should not result in those consequences, we recommend you backup your system prior to proceeding. Epic Games takes no responsibility for any damage caused to your system by modifying the system registry.
You need to add two registry keys to your graphics drivers. Follow these steps to add the registry keys.
-
Type 'run' into the Windows operating system search bar. Open the Run application.
Click image for full size.
-
In the search field, type 'regedit'. Click OK to open the Registry Edit Tool.
Click image for full size.
-
Navigate to the GraphicsDrivers section of the navigation on the left side of the Registry Edit tool. The location for this is
Computer\HKEY_LOCAL_MACHINE\SYSTEM\CurrentControlSet\Control\GraphicsDrivers.Click image for full size.
The registry keys need to be added to the GraphicsDrivers folder, not any of its children. Be sure to select the correct folder.
-
The registry key you need is called
TdrDelay. If this registry key already exists, double-click to edit it. If it does not already exist, right-click in the pane on the right and select New > DWORD (32-bit) Value.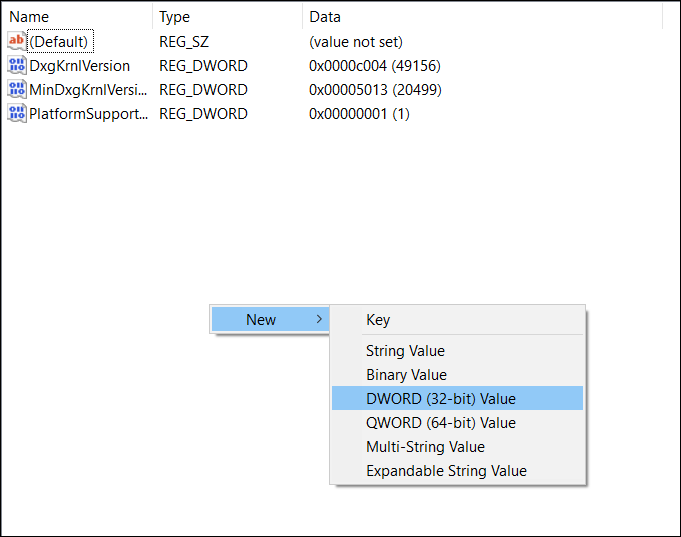
-
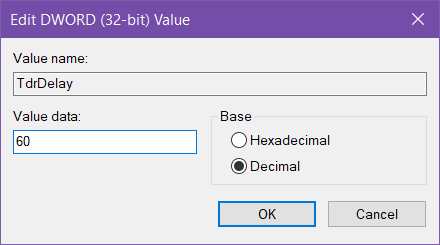
Set the Base to Decimal. Set the Value of TdrDelay to 60. Click OK to finish.
-
You need a second registry key called
TdrDdiDelay. If this registry already exists, double-click to edit it. If it does not already exist, right-click in the right hand pane and select New > DWORD (32-bit) Value to create it. -
Set the Base to Decimal. Set the Value of
TdrDdiDelayto 60. Click OK to finish.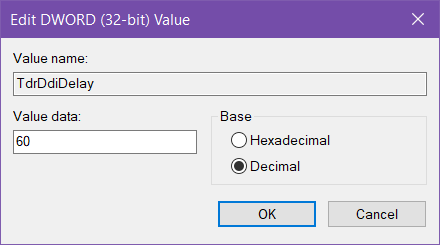
-
Your registry should now include both
TdrDelayandTdrDdiDelay.Click image for full size.
-
Close the Registry Editor.
-
Restart your computer for these changes to take effect.
By adding these registry keys, Windows will now wait for 60 seconds prior to determining that the application has taken too long for its process.
Although this is a good way to curb GPU crashes based on rendering, this will not resolve all crashes. If you try to process too much data at once, the GPU may time out regardless of how long you set the timeout delay. This solution is only designed to give your graphics card a little extra time.
Investigating Bugs in the Engine Code, Drivers and Operating Systems
Bugs in the engine code, drivers, or operating systems can also cause GPU crashes. These are some common things you can do to start investigating the cause of a GPU crash when OOM and TDR events have been eliminated as the root cause.
- Run the engine with
-gpucrashdebuggingand-d3ddebug(separately as described in earlier). - Run the engine with
-onethreadand-forcerhibypassto force the engine to run with only one thread. This helps determine if the underlying problem is a threading / timing issue. - Run the engine with
r.RDG.Debug=1to provide information about render passes that have not been properly set. - Run the engine with
r.RDG.ImmediateMode=1to force the Render Dependence Graph (RDG) to execute passes immediately after creation. It can give you more meaningful callstacks. Note that this could give you misleading clues since it changes other things as well. It's still worth using for investigative purposes. - Switch to a different RHI. For example, if you are using DirectX 12 (DX12), you can switch to DirectX 11 (DX11). If the crash only happens in one of them, that could help identify if the problem is at a higher or lower level. Note that some features only work with a specific RHI (such as Hardware Ray Tracing only being supported by DX12).
- Use A/B Testing for your scene:
- Turn rendering passes on and off to check if the crash occurs. Many times, the problem is a faulty pass and doing this type of check can give good clues on what is going on.
- Turn rendering features on and off, such as Lumen, Nanite, Ray Tracing. Note that some of these may require a system restart.
- Hide / Show specific objects in the scene. This could isolate if problems are related to a specific asset.
When considering if a GPU crash is related to a specific driver, all of the above information applies and you should also get the most up-to-date drivers available. You may also want to check with the manufacturer for known issues this driver may cause.
When considering if a GPU crash is related to the operating system, all of the above information applies. Also, for Windows, we strongly recommend using version 20H2. You can find out which version of Windows you are using by pressing the Windows key and typing in winver.