
Use the Blueprint Debugger to pause the execution of your Project during Play-In-Editor(PIE) or Simulate-In-Editor mode. Once paused, you can step through any Blueprint or Level Blueprint graph through the use of Breakpoints.
Debugging Controls
The Blueprint Debugger controls become enabled in the Toolbar when the Project is running.
Different debugging controls will appear depending on the type of Blueprint you are debugging and the current state of the debugging session. Some controls only appear when relevant, such as when a Breakpoint is reached.
The Blueprint Debugger window is available from the Tools menu, or from the Debug menu within the Blueprint Editor. This window will display context-sensitive debugging buttons when PIE or SIE modes are active.
Breakpoints
Breakpoints are markers that can be placed on Blueprint graph nodes.
When a node with an active Breakpoint is about to be executed during PIE or SIE mode, the simulation will pause and you will be navigated to the node in the Blueprint Editor's graph view. Once paused, you can observe the values of variables and step through the flow of execution within the Blueprint.
All Breakpoints for a given Blueprint are displayed in the Blueprint Debugger window, and can be viewed in the Blueprint's graph when selected.
To place a Breakpoint on a node, right-click the node and select Add Breakpoint from the context menu. Once placed, a solid, red octagon will appear in the upper-left corner of the node. The Breakpoint can be removed by right-clicking the node, or the Breakpoint's entry in the debugger window, and selecting Remove Breakpoint.

This Breakpoint will interrupt the game at the moment before the Print node is executed.
To disable a Breakpoint temporarily without fully removing it, you can right-click either the Blueprint node, or the Breakpoint's entry in the Debugger window, and select Disable Breakpoint from the context menu.
A disabled Breakpoint will appear as an outline of a red octagon. Disabled Breakpoints will not execute until they are re-enabled. Disabling Breakpoints is more convenient and less prone to human error when compared to removing and recreating Breakpoints repeatedly.

This Breakpoint has been disabled and currently does not execute, however it can be re-enabled if needed.
To enable a disabled Breakpoint, right-click the node and select Enable Breakpoint or click the octogonal icon next to the Breakpoint in the Debugger window. This can also be done by right-clicking the Breakpoint in the Debugger window and selecting Enable Breakpoint.
Breakpoints can be created, disabled, enabled, or removed at any time, including during a debugging session. Breakpoints are saved in your Project's .ini files, so they will persist between Editor sessions, but will not be duplicated for other developers on your project.
If a Breakpoint is placed at an invalid location, it will appear as a yellow icon with an exclamation point.
Compiling the Blueprint can sometimes resolve the issue, however if it does not, hovering over the Breakpoint icon will display a warning message.

This Breakpoint is invalid and will never be reached. In some cases, recompiling the Blueprint can resolve this.
When pausing execution with a Breakpoint, the editor will highlight the node and will place a large, red arrow over it.

This Breakpoint has just been reached, and the execution has been paused.
Watches
Watches keep track of Blueprint node pin values so they can be viewed during debugging sessions.
A watched pin retains the value that was assigned during the most recent execution of its node in the graph.
To begin watching a pin, right-click the pin's name in the Blueprint Graph and select Watch this value from the context menu. Pins that you are already watching will display Stop watching this value instead of Watch this value in the context menu.

While stopped at a breakpoint, hovering over any pin will display an interactive tooltip with more immediate debug information, exactly like what you'd see in the debugger if the pin was being watched.
Pins whose nodes have not yet been executed do not have debugging information available and will show a message indicating this fact rather than a data value.
This is because the pin's value is only updated when the node executes its underlying code at least once.
Even Blueprint variable nodes need to execute code to retrieve the variable's value and will do so only when another node attempts to access its output value.
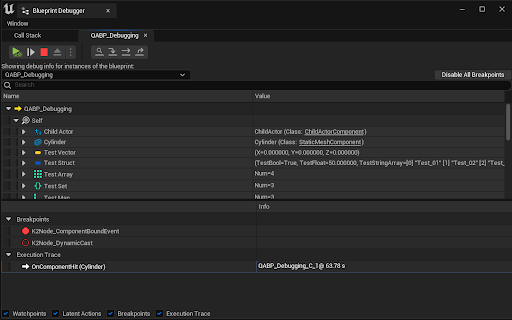
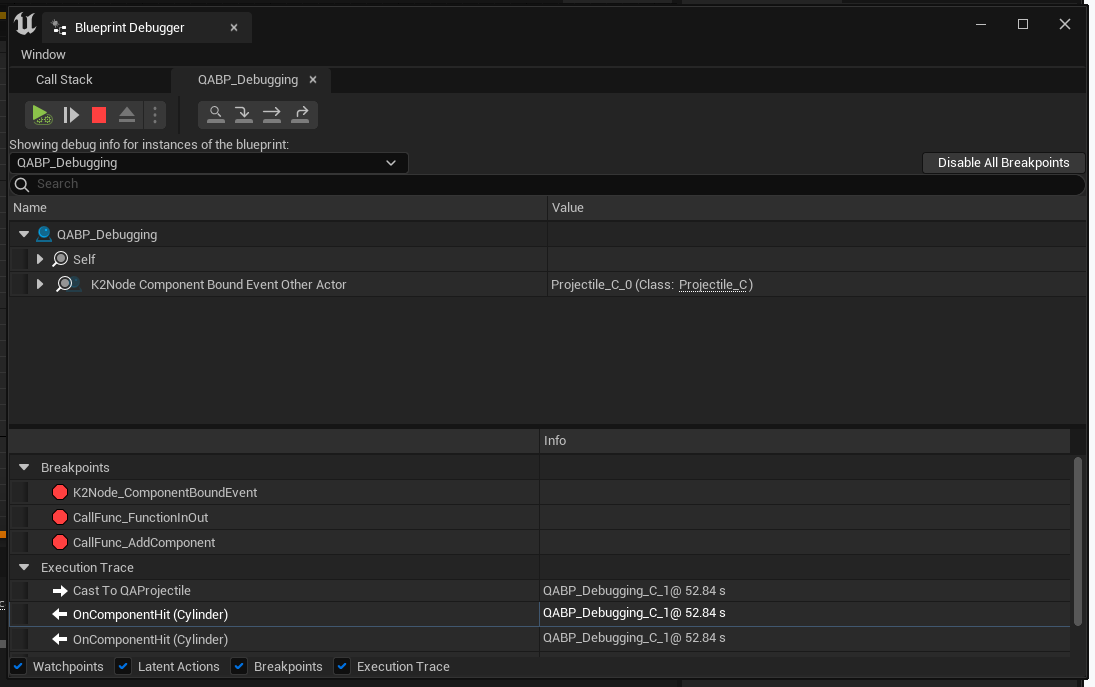
Blueprint Debugger
The Blueprint Debugger window shows Breakpoints, Watchpoints, and the Execution Trace stack.
This window also features execution controls which you can use to stop, resume, or step through your code when using Breakpoints.
You can use tabs to switch between the full execution call stack and the Breakpoint, Watch, and call stack information for specific Blueprint instances.

Data Flow tab
The Data Flow tab speeds up debugging by displaying all the data you want to watch.
It supports object filtering which lists all instances of your chosen Blueprint class, and any of the properties from this Blueprint can be inspected.
You can watch Blueprint classes that you open in the editor and that are part of the current call stack.
When execution pauses, you can see a consolidated call stack populated with current data.
You can jump between Blueprints from here to inspect property values and node outputs.
This view supports the expansion of Arrays, Sets, Maps, and other data structures, providing you with an efficient way to observe any data they contain.
Call Stack
The Call Stack that is available during Blueprint debugging sessions is similar in concept to the call stack that is found in most C++ development environments.
The Call Stack reveals the flow of execution between Blueprints visual scripting functions and native (C++) code functions. The Blueprint visual scripting function that is currently executing is listed at the top of the stack.
Blueprint Macros do not show up in the Call Stack. Instead, they appear as part of the function from which they were called.

The Blueprint Function above recursively performs a factorial calculation. A Breakpoint has been placed at the end of the function.
When a Breakpoint is reached, the Call Stack lists the functions currently being executed, starting with the current function at the top, and proceeding downward to the calling functions.
This means that each line entry contains the name of a function that was called by the function listed immediately below it. In the case of a recursive (self-calling) function, the same function name may appear multiple times in the stack.

This Call Stack shows a five-level recursive call into the Factorial function shown above. The function was originally called from the Actor's main Blueprint graph, which in turn was triggered by the BeginPlay Event called from native (C++) code.
The Blueprint call stack can be tedious to inspect from the C++ call stack. To get a snapshot of the Blueprint call stack in your IDE, call {,,UnrealEditor-Core}::PrintScriptCallstack() in the Immediate window when stopped at a breakpoint. This only works in editor builds.
Execution Trace
The Execution Trace stack shows a list of nodes executed with the most recent node listed at the top.
This list updates as you step through the graph when debugging.